
Market Insights from Black Book
Despite the limited inventory on dealer lots, dealer lanes continue to have higher volume at auction, while manufacturers’ remarketing lanes are offering less and less in open sales channels.

Despite the limited inventory on dealer lots, dealer lanes continue to have higher volume at auction, while manufacturers’ remarketing lanes are offering less and less in open sales channels.
BLACK BOOK – Here is a quick recap of industry related headlines over the last week:
Wholesale Prices, Week Ending August 7th
July sales finished strong, but available new and used inventory remains limited. This is continuing to prove challenging for dealers to keep up the pace of business. With many new car dealers facing days supply at record lows, they are being forced to look for the few used vehicles left in the market that are viable substitutes for their lack of new vehicles. The declines in pricing that are being seen in the market are for average vehicles with average to high mileage.
This Week Last Week 2017-2019 Average (Same Week)
Car segments -0.78% -0.68% -0.31%
Truck & SUV segments -0.54% -0.47% -0.20%
Market -0.62% -0.54% -0.25%
Car Segments
On a volume-weighted basis, the overall Car segment decreased -0.78%. For reference, the previous week decreased by –0.68%.
Sub-Compact Cars ended a 25-week streak of increases, with a decline of -0.18%.
Mid-Size and Compact Cars had the steepest declines at –1.35% and -1.30%, respectively
Premium Sporty Cars reported the lowest declines at -0.06%.
Truck / SUV Segments
The volume-weighted overall Truck segment declined -0.54%, an increase in depreciation from previous week’s decline of -0.47%.
Full-Size Vans were the only segment to report gains this past week, with an increase of +0.17%.
The Compact Crossover segment had the largest Truck segment decline at -1.01%, while the more spacious Mid-Size (-0.14%) and Full-Size Crossovers (-0.005%) reported only minimal declines.
Weekly Wholesale Index
Calendar year 2020 ended with used wholesale prices at elevated levels. With economic patterns (including the automotive market) driven by the pandemic, normal seasonal patterns (e.g., 2019 calendar year) in the wholesale market were not observed for most of the year. We saw a similar picture in 2009, at the end of the Great Recession. Calendar year 2021 has not had typical seasonality patterns as the market has had rapid increases in wholesale values for the majority of the year. After reaching record heights at the end of June, wholesale prices started to come down for the first time this year in July.
The graph below looks at trends in wholesale prices of 2-6-year-old vehicles, indexed to the first week of the year.
Black Books’ Seasonally Adjusted Monthly Retention Index – July
As wholesale prices started to decline in July, the seasonally adjusted Retention Index reversed the trend for the first time this year and decreased to 161.8 points, a 4.2 point (or 2.6%) decrease from June (166.0). The Index currently stands 28.4% above where it was the same time last year, during the recovery of the used market, after COVID-19 related closures in the Spring of 2020.
Retail (Used and New) Insights
As COVID-19 cases are surging across the country, the industry is having to make some adjustments. The New York Auto Show has officially been cancelled for a second year in a row and US automakers announced the return of mask mandates in their manufacturing facilities, only months after they had officially removed the mandates.
President Biden signed an executive order last week, setting a target of 50% of all new vehicle sales to be zero-emissions by 2030.
July sales were strong for many OEMS, with Hyundai & Kia, Toyota, Mazda, and Volvo reporting large gains compared to 2020, but others like Ford reported declines as a result of the microchip shortage leaving their dealers with a short supply of available inventory on dealer lots.
Used Retail Prices
With the proliferation of ‘no-haggle pricing’ for used-vehicle retailing, asking prices accurately measure trends in the retail space. Retail demand slowed down at the end of last year, and thus resulted in declining retail asking prices for the last several weeks of 2020. As demand rebounded, retail prices have lagged slightly behind wholesale prices, but March had an accelerated growth in retail prices. In April and May, retail prices picked up speed as demand accelerated, fueled by stimulus payments, tax season, and shortages of new inventory. In June, retail prices continued to rise. After strong Spring and Summer months, retail listing prices have started to fall. Currently, retail prices are more than 24% above where we started the year.
This analysis is based on approximately two million vehicles listed for sale on US dealer lots. The graph below looks at 2-6-year-old vehicles.
Inventory
Used Retail
Current used retail listing volume is about 11% below the start of the year. As retail demand softened in the last several weeks (both for new and used vehicles), used inventory had remained relatively flat but is now starting to decrease again.
Days-to-turn for used retail listings have been increasing, as retail demand softened over the last few weeks. The days-to-turn now sits just below 34 days, which is still lower than what is typically expected in a normal year.
Wholesale
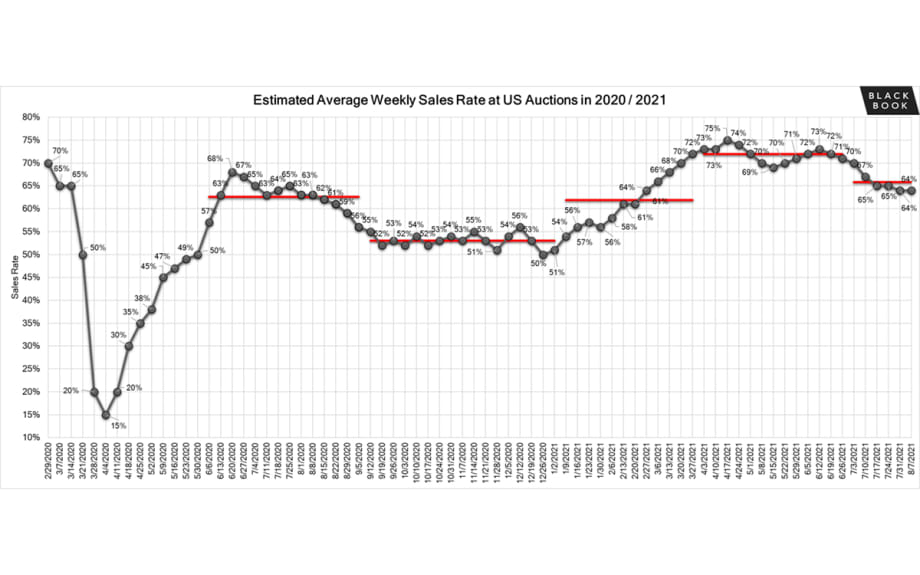
Floor pricing remains strong, but with availability of vehicles continuing to be a challenge, the sales rates this past week stabilized at 64%. However, conversion rates remain extremely strong for low mileage, newer used units.
Despite the limited inventory on dealer lots, dealer lanes continue to have higher volume at auction, while manufacturers’ remarketing lanes are offering less and less in open sales channels. Dealers have found creative ways to diversify their source of inventory.
ADESA announced a pilot program to test out the impact of physically running vehicles across the lanes. They have selected 11 different locations across the country as their sample set for the 90-day test.
More Auto Finance

Mastering Credit Friction
In this video, Josh Krach explains how to turn credit friction into an advantage.
Read More →
April Less Affordable
Based on prices, reduced incentives and slower household income growth, consumers found it more challenging to buy new last month, Cox Automotive reported.
Read More →
Auto Lenders, Consumers on a Tightrope
April borrowing data shows that more consumers are bending over backward to buy vehicles, though subprime lending cooled off for the month.
Read More →
Toyota Financial Services President Replaced
Scott Cooke has served in various roles with Toyota Financial Services for over 20 years, including president and CEO, which he retires from on June 30.
Read More →
Permission or Approval: When to Notify Finance Sources
Credit card down payments, multiple vehicle purchases and even straw purchases can be completed without committing bank fraud, as long as you tell the bank first.
Read More →
At-Risk Auto Borrowers Drive Looser Credit Access
Cox Automotive’s index shows the subprime segment, long loan terms, negative-equity borrowers and down payment amounts all grew in February despite ever-higher vehicle prices.
Read More →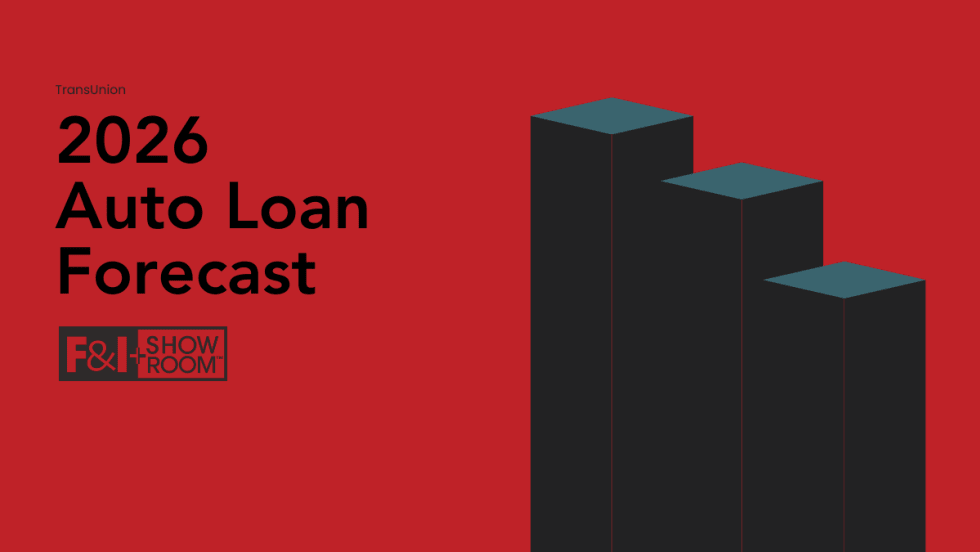
Auto Loan Forecast Bucks Market Trend
Auto loan originations rose over 6% year-over-year in the third quarter of 2025, but TransUnion predicts a slight decline in auto loan growth this year, making it an outlier in the company's overall lending forecast.
Read More →
Auto Credit More Plentiful
Growing access shows greater lender appetite for risk as consumers take on heavier debt burden in an inflated market.
Read More →
Auto Loans Long as Stretch Limos
More consumers, faced with ever-rising car prices, are adapting by agreeing to longer loan terms despite the cost of added interest payments.
Read More →
AutoPayPlus Launches RePayPlus
The reinsured biweekly payment program offers auto dealers with customer retention and reinsurance structure.
Read More →