Videos
Managing Expectations
Learn how proactive communication, setting clear expectations, and providing solutions when plans change can strengthen customer trust and improve the overall service experience.
Read More →

 MENU
 SEARCH
Learn how proactive communication, setting clear expectations, and providing solutions when plans change can strengthen customer trust and improve the overall service experience.
Read More →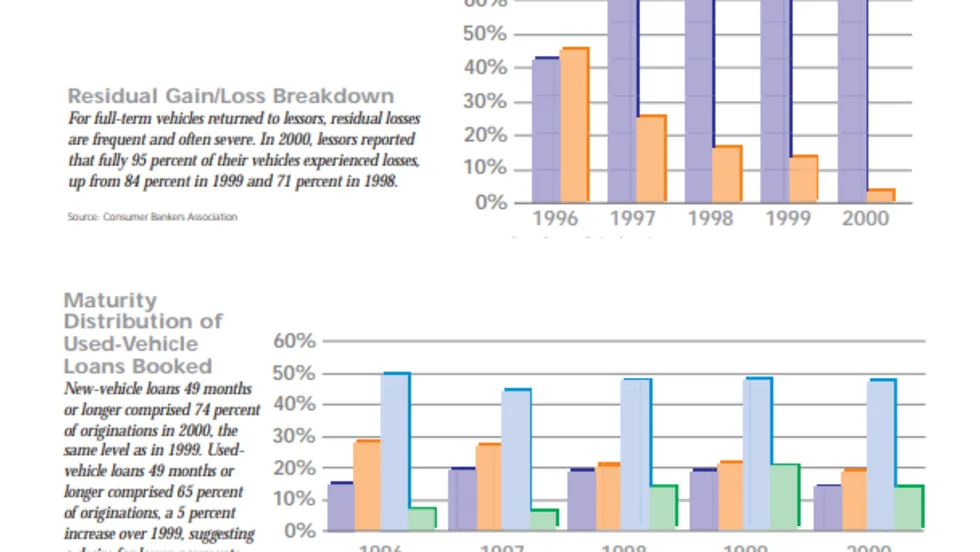
Customers with Negative Equity on a Trade Residual Gain/Loss Breakdown Maturity Distribution of Used-Vehicle Loans Booked
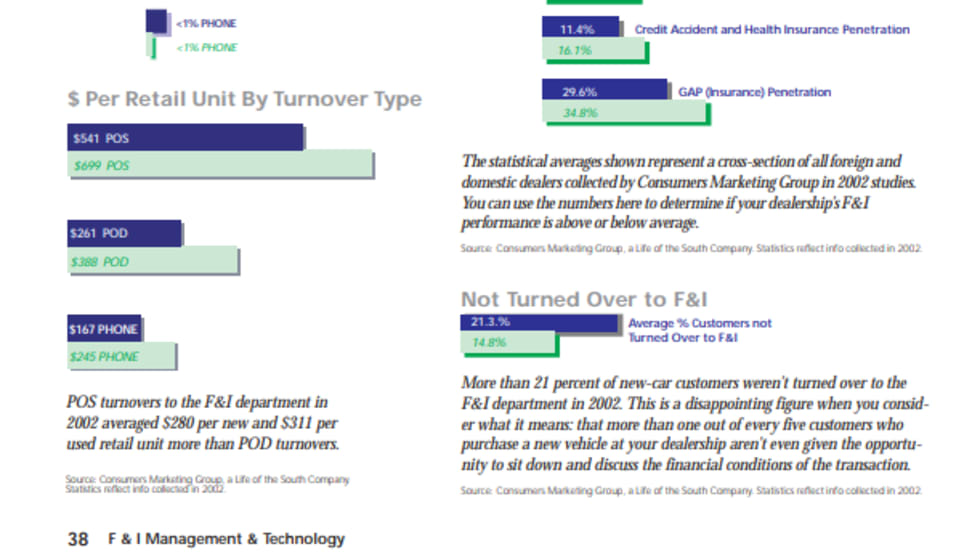
Profit Contribution Index F&I Penetration for the Average Dealership When Is the Customer Turned Over? $ Per Retail Unit By Turnover Type Not Turned Over to F&I
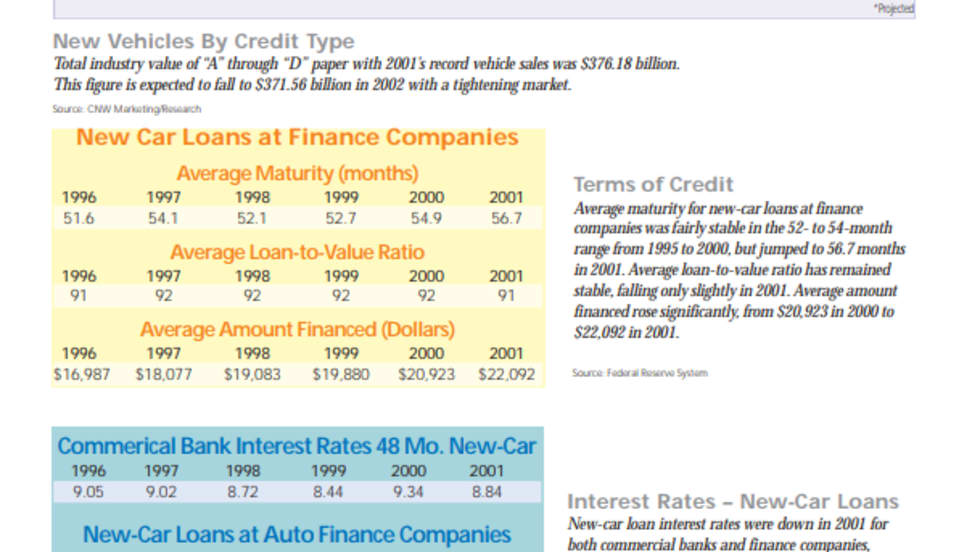
National Rate Tier Averages of Major Indirect Retail Lenders New Vehicles By Credit Type Terms of Credit Interest Rates – New-Car Loans Buyers Paying Cash Gross as % of Selling Price Percentage of Gross Charge-Offs to Bankruptcy Service Contract Penetration Rates F&I Contributions to Dealership Profits Profit/Loss (Percentage) Excluding F&I Aftermarket Income as % of New- and Used-Vehicle Department Gross Profit
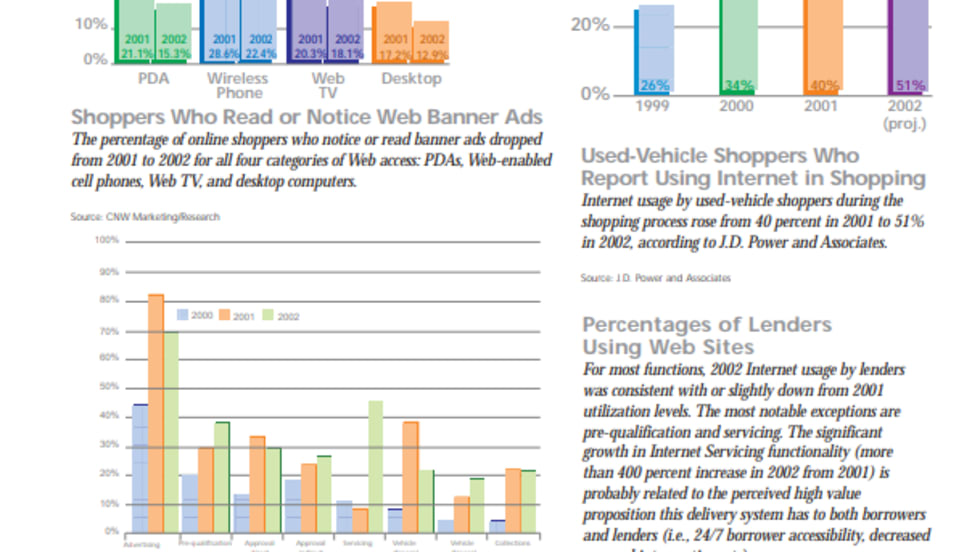
Shoppers Who Read or Notice Web Banner Ads Used-Vehicle Shoppers Who Report Using Internet in Shopping Percentages of Lenders Using Web Sites Preference for Online Financing
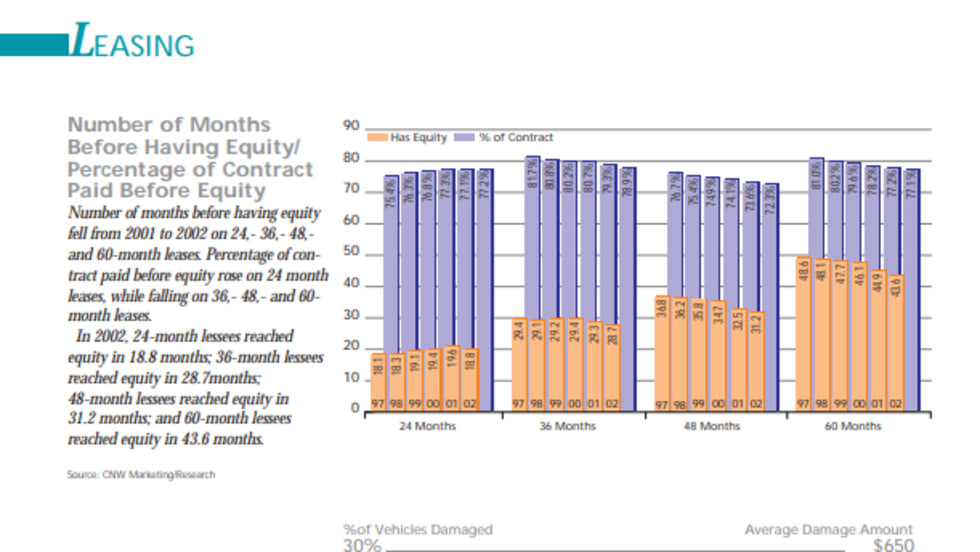
Number of Months Before Having Equity/ Percentage of Contract Paid Before Equity Excess Damage at Lease End Lease Residual Support Off-Lease Vehicles by Lease Term Lease Share by Source Disposition of Vehicle Leases That Reached Full Term New-Vehicle Sales Financed Through Leases Banks Pull Back From Leasing Consumer Lease Trends Personal Use Leasing Lessees with Excess Mileage Who Buy Vehicle Used-Vehicle Leasing
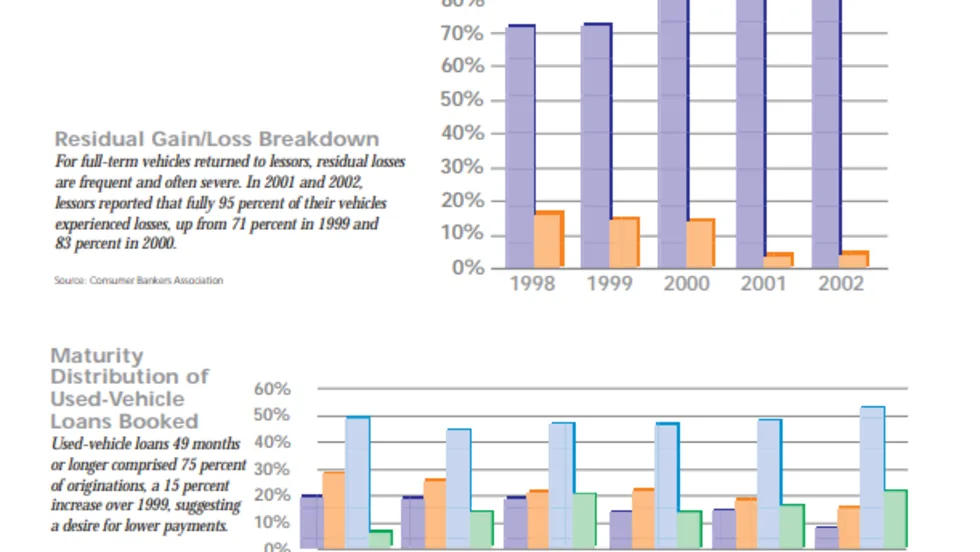
Of Those Trading, Percent w/Negative Equity Customers with Negative Equity on a Trade Residual Gain/Loss Breakdown Maturity Distribution of Used-Vehicle Loans Booked
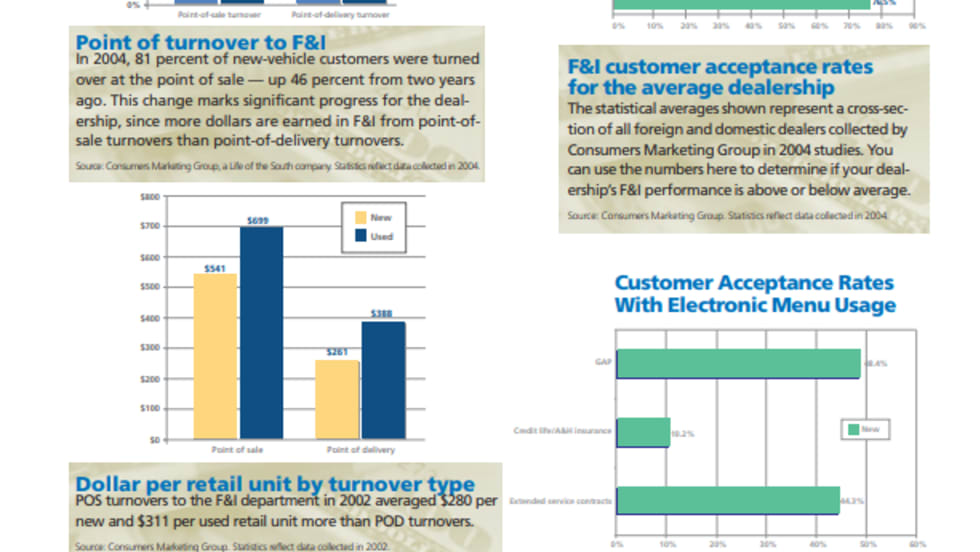
Profit Contribution Index Point of tunover to F&I F&I customer acceptance rates for the average dealership Customer acceptance rates with electronic menu usage Dollar per retail unit by turnover type F&I contributions to dealership profits F&I is about 17% of time in dealership Service contract penetration rates Average dollars per transaction
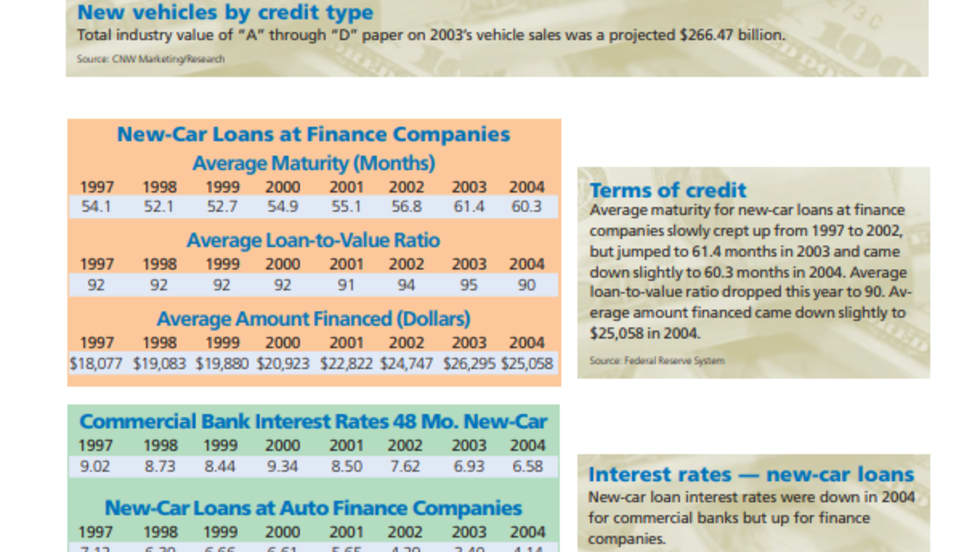
National Rate Tier Averages of Major Indirect Retail Lenders New Vehicles By Credit Type Terms of Credit Interest Rates – New-Car Loans Buyers Paying Cash Gross as percentage of Selling Price Percentage of Gross Charge-Offs attributable to Bankruptcy Delinquencies on indirect new-vehicle loans The auto finance market in the United States F&I Contributions to Dealership Profits Profit/Loss (Percentage) Excluding F&I
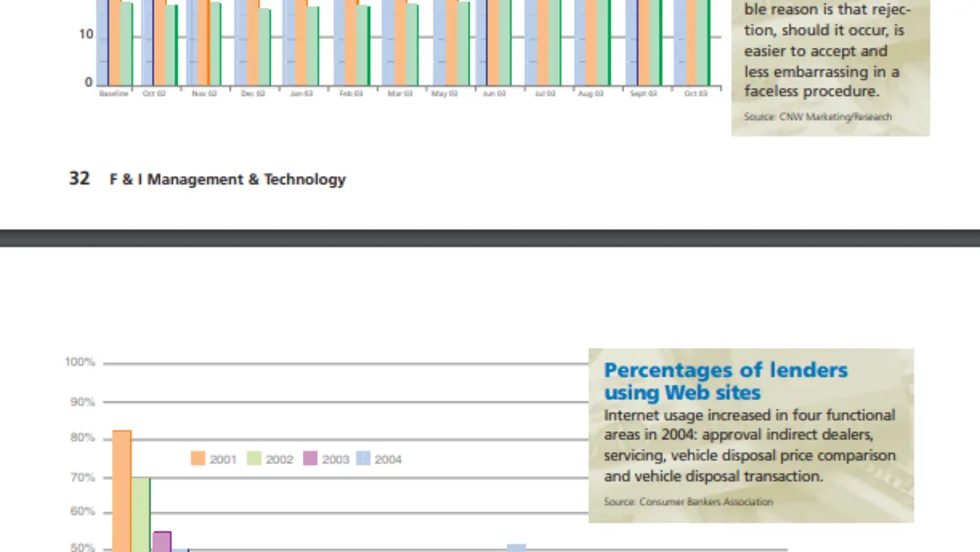
Comparison of Web-based credit scores to non-Web-based scores Total Web-based loan approval rates Used-Vehicle Shoppers Who Report Using Internet in Shopping Percentages of Lenders Using Web Sites Preference for Online Financing
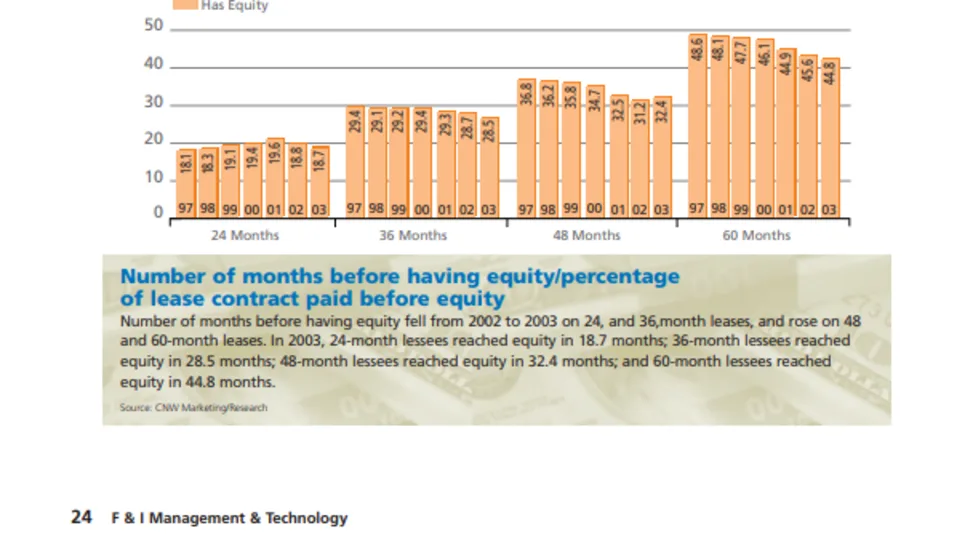
Number of Months Before Having Equity/ Percentage of Contract Paid Before Equity Excess Damage at Lease End Prime loan distribution by credit score Nonprime loan distribution by credit score Lease Share by Source Disposition of Vehicle Leases That Reached Full Term New-Vehicle Sales Financed Through Lease Banks Pull Back From Leasing Consumer Lease Trends Credit score distribution - leases Lessees who buy vehicles with excess miles Lease residual