

Auto Incentives Down to Pre-Recession Levels in December
Edmunds.com estimated that the average automotive manufacturer incentive in the U.S. market was $2,528 per vehicle sold in December 2010, up $64, or 2.6 percent, from November 2010, but down $26, or 1.0 percent, from December 2009.
SANTA MONICA, Calif. — Edmunds.com estimated that the average automotive manufacturer incentive in the U.S. market was $2,528 per vehicle sold in December 2010, up $64, or 2.6 percent, from November 2010, but down $26, or 1.0 percent, from December 2009.
“Incentives have dropped back to pre-recession levels after surging in 2009 as manufacturers tried anything they could think of to lure customers to buy their vehicles,” stated Edmunds.com Senior Analyst Michelle Krebs in her report on AutoObserver.com. “While industry averages are down, spending by Japanese automakers in aggregate is up, led by Toyota as it tries to recoup from recalls that triggered a sales slump.”
According to Edmunds.com, combined incentives spending for domestic manufacturers averaged $3,301 per vehicle sold in December 2010, up from $3,215 in November 2010. From November 2010 to December 2010, European automakers increased incentives spending by $18 to $2,376 per vehicle sold; Japanese automakers increased incentives spending by $34 to $1,821 per vehicle sold; and Korean automakers decreased incentives spending by $118 to $1,508 per vehicle sold.
True Cost of Incentives for the Top Six Automakers | ||||||
Automaker | December 2010 | November 2010 | December 2009 | |||
Chrysler Group | $3,349 | $3,099 | $2,585 | |||
Ford | $3,188 | $3,173 | $3,049 | |||
General Motors | $3,370 | $3,300 | $4,017 | |||
Honda | $1,521 | $1,419 | $1,257 | |||
Nissan | $2,121 | $2,180 | $2,161 | |||
Toyota | $1,983 | $1,951 | $1,666 | |||
Industry Average | $2,528 | $2,464 | $2,554 | |||
“Looking at year-end averages, Honda, Nissan and Toyota are each spending more than they did in 2008 or 2009; on the other hand, each of the domestic automakers dramatically lowered its incentives in 2010 and yet collectively gained market share,” reported Edmunds.com Analyst Ivan Drury.
Annual True Cost of Incentives for the Top Six Automakers | |||||||||
Automaker | 2008 | 2009 | 2010 | ||||||
Chrysler Group | $ 3,869 | $ 4,131 | $ 3,195 | ||||||
Ford | $ 3,369 | $ 3,334 | $ 3,173 | ||||||
General Motors | $ 3,573 | $ 3,889 | $ 3,515 | ||||||
Honda | $ 1,201 | $ 1,276 | $ 1,563 | ||||||
Nissan | $ 2,098 | $ 2,455 | $ 2,519 | ||||||
Toyota | $ 1,317 | $ 1,598 | $ 2,119 | ||||||
Industry Average | $ 2,588 | $ 2,794 | $ 2,608 | ||||||
In December 2010, the industry's aggregate incentive spending is estimated to have totaled approximately $2.85 billion, up 32.9 percent from November 2010. Chrysler, Ford and General Motors spent an aggregate of $1.7 billion, or 59.7 percent of the total; Japanese manufacturers spent $774 million, or 27.2 percent; European manufacturers spent $250 million, or 8.8 percent; and Korean manufacturers spent $125 million, or 4.4 percent.
Among vehicle segments, premium sport cars had the highest average incentives, $5,757 per vehicle sold, followed by large cars at $4,686. Subcompact cars had the lowest average incentives per vehicle sold, $1,212, followed by vans at $1,737. Analysis of incentives expenditures as a percentage of average sticker price for each segment shows large cars averaged the highest, 14.7 percent, followed by large trucks at 10.3 percent of sticker price. Premium luxury cars averaged the lowest with 3.3 percent and luxury SUVs followed with 4.3 percent of sticker price.
Comparing all brands, in December Subaru spent the least, $522, followed by Scion at $881 per vehicle sold. At the other end of the spectrum, Saab spent the most, $7,998, followed by Mercury at $6,448 per vehicle sold. Relative to their vehicle prices, Mercury and Saab spent the most, 21.6 percent and 19.3 percent of sticker price, respectively; while Porsche spent 1.6 and Subaru spent 2.0 percent.
More F&I

AI: Facilitator, Not Fixer, in F&I
The dealerships that thrive in the years ahead will be those that embrace technology while continuing to invest in the people who make customer interactions count.
Read More →
Modern Technology Objection Handling
In this video, Trent White shares how to confidently handle technology-based objections by helping customers understand the value of protection, even with modern vehicle technology.
Read More →
Consistency at Scale: Driving F&I Performance
With 75 rooftops across the Sunshine State, Morgan Auto Group has proven to Floridians that it knows a thing or two about driving performance in a competitive market. But it didn’t start at the top.
Read More →
Gitty Up on GAP
The foundational finance-and-insurance product hasn’t kept up with the latest conditions for auto dealers. Is the time ripe?
Read More →
How AI-Powered Coaching Is Transforming F&I Performance
See how AI-powered coaching can turn F&I customer conversations into actionable insights that support compliance, performance and profitability
Read More →
Sell Value, Build Trust
In this video, Trent White explains why selling on value, not fear, builds lasting customer trust, reduces cancellations, and drives long-term success.
Read More →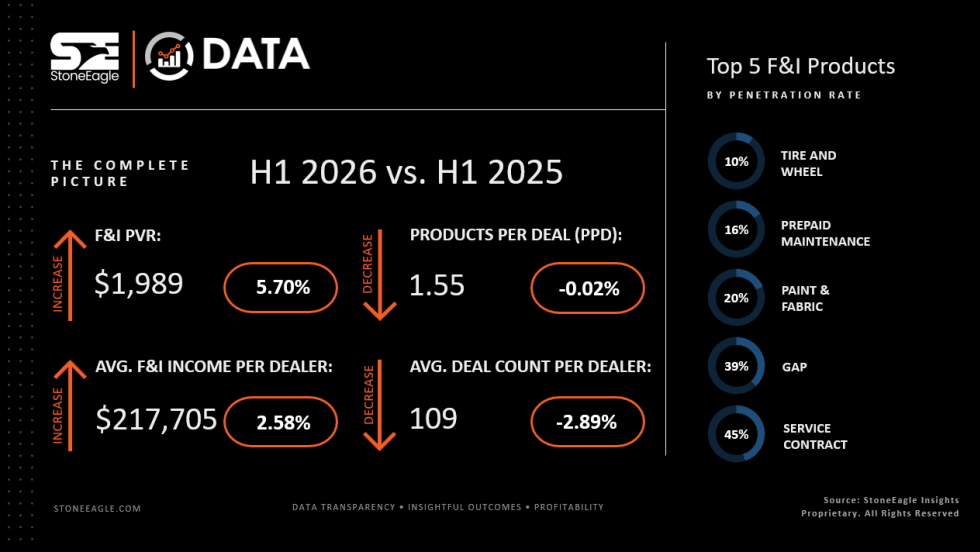
F&I Sales Give Dealers First-Half Lift
Product business shored up total profits to avoid an overall revenue tanking as product penetrations held steady, StoneEagle reported.
Read More →
Targeted Training Drives Results
Today’s technology, instead of threatening F&I managers, can actually make them better, according to an industry veteran who’s watched market setbacks roil the unprepared.
Read More →
Double the Change, Double the Chance
When an F&I manager gets a customer refusal, it’s a wise move to tweak more than one thing in the product offering.
Read More →
Just Do It
F&I managers need training, but instead of resisting application or expecting perfection, they should improve by simply acting on what they learn.
Read More →