
COVID-19 Market Update
Black Book recently published an update to their COVID-19 Market Updates, which includes: current wholesale prices & price trends, used wholesale price trends & projections, a look at the retail vertical, new vehicle sales outlook, and used vehicle supply projections.

Black Book recently published an update to their COVID-19 Market Updates, which includes: current wholesale prices & price trends, used wholesale price trends & projections, a look at the retail vertical, new vehicle sales outlook, and used vehicle supply projections.
Image provided by Black Book
SUMMARY
Wholesale Values
As we entered the last week of June, federal stimulus, together with still limited used vehicle inventory, helped to maintain the strength of wholesale prices across almost all vehicle segments. Volume-weighted overall car and truck segments both showed gains for the sixth week in a row, increasing 0.90% overall and surpassing pre-COVID-19 heights achieved in early March. This is a slowdown from the previous two weeks but is still one of the highest weekly market increases we’ve tracked. As for specifics, the overall car segments increased by 1.19% (compared to 1.91% the prior week) and the overall trucks and SUV segments increased again this past week at 0.73% (compared to 1.15% the prior week).
A deeper dive into the data reveals that in addition to raw auction prices being higher this year, the mix of vehicles in the marketplace is also different: This year, we see cleaner vehicles with significantly lower mileage (3,000 to 6,000 miles less compared to the same three-year-old vehicle a year ago on many popular three-year-old models) hitting the wholesale market. When adjusted for condition and mileage (a true apples-to-apples comparison), prices at the end of June finally climbed to where they were at the end of June 2019.
For the whole month of June, we saw the largest recorded month-over-month increase in wholesale prices, as measured by Black Book’s Monthly Seasonally Adjusted Retention Index, increasing by a staggering 9.1 points. This increase corresponds to a 5.7% increase in wholesale prices. Full analysis of June’s Used Vehicle Retention Index will be available later this week as a separate update, when we release our June Index.
Wholesale Volume
Auction sales volume has returned to pre-COVID-19 levels, with most auctions continuing to operate in a digital only environment. Three weeks ago, we received word that a limited number of Manheim operating locations were going to allow sellers to represent their vehicles on the block during a pilot period. These Digital Block sales offer in-lane bidding with a live auctioneer, however, vehicles do not run through the lanes. They announced early this week that they will be adding 12 more sites to the list of participating auctions. ADESA has also followed with their own pilot program with 22 locations allowing limited in-lane bidding. These changes at large auction houses come on the heels of the success of independent and smaller auction chains who opened back up to in-lane sales over the last few weeks. Demand has been high and dealer attendance, both in person and online, has been significant at these independent auctions, with many achieving above average sales volume and retention. Buyers have been vocal about their desire to attend these sales in person, adding to the pressure received from the large auction houses.
Although we see some recovery in rental demand (outside of airport business), we measured a substantial increase (compared to previous weeks and compared to last year) in volume of rental units sold, as rental fleet companies are beginning to de-fleet and reduce their inventory to match much weaker consumer and business traveler demand. As the supply continues to grow, we are concerned with the throughput at major auctions, as they continue to operate with reduced staff, and with the direct to dealer channel, as there is a shortage of personnel too. In our continuous conversations with management teams from major auction chains, they report that they are trying to execute on the increased volume and customer demand without immediately bringing back significant amounts of furloughed staff. There is a concern that this uptick may be short-lived and the need for increased staff may be temporary.
Economic Conditions
Since the beginning of April, weekly initial unemployment claims remained at record levels. Last week, the Labor Department reported that the US added 1.43 million new jobless claims. Since March, we have seen 15 consecutive weeks of record level layoffs and furloughs. The severity and speed of job losses is unprecedented.
In the early stages of the crisis, the US unemployment rate in April rocketed to 14.7%, the highest monthly rate since the Great Depression. The May unemployment level decreased to 13.3% due to the success of the Federal Paycheck Protection Program (PPP) and other stimulus measures enacted in part by the Federal Reserve and Government. As the country and economy continued to reopen during the early part of June, the monthly unemployment numbers eased further to 11.1%. The Labor Bureau also noted in its reports that there was a classification error in its surveys, and the real unemployment numbers were actually higher for each month since March.
Note that monthly unemployment numbers are based on a snapshot from mid-month, but the last several weeks of June suggest that conditions worsened due to the dramatic increase in COVID-19 cases and reopening slowing as a result. There is also concern that without further federal stimulus, these gains will be temporary and employment numbers may deteriorate once the PPP expires. According to a recently released CBO report, “the unemployment rate is projected to peak at over 14 percent in the third quarter of this year” before declining in the fourth quarter.
This recession is very different and unprecedented in the labor market – reflecting an almost instantaneous jump in unemployment with projected fast growth within a year.
Although we have seen a reduction in unemployment, the initial economic shock and job losses have created a deep hole for us to dig ourselves out of: between February and end of June, we lost close to 14.7 million jobs.
With a weakening of the economy and the increase of new COVID-19 cases across the South, consumer confidence remains low. The University of Michigan’s Monthly Consumer Sentiment Index in February was 101 points. As the COVID-19 pandemic spread across US, the index dropped to 71.8 points in April and increased slightly to 72.3 points in May. During recent testimony by Federal Reserve Chair Jerome Powell, he noted that during the months of April and May, “stimulus checks and unemployment benefits are supporting household incomes and spending.” With these one-time stimulus payments and extended unemployment benefits helping the economy, the index for June increased further to 78.1. The gains, however, were not uniform across the country. With a significant reduction in the number of COVID-19 cases, the Northeast region led the way with a record 19.1 points month-over-month jump, while the Southern region rose just 0.5 points due to the dangerous increase in numbers of new infections and fear of further shutdowns.
As more economic data for the second quarter of 2020 arrives, “the GDPNow model [from the Federal Reserve] estimate for real GDP growth (seasonally adjusted annual rate) in the second quarter of 2020 was -35.2 percent on July 2nd.”
The overall weakening of the economy is causing demand for vehicle purchases to decline. In addition, gasoline prices reversed the May trend, and started to increase, up $0.40 since the lowest point at the end of April, to $2.17 per gallon last week, according to the U.S. Energy Information Administration.
Used Inventory
At the same time, we expect a large, incremental influx of used inventory to hit the marketplace over the next six months, coming from prolonged lease return delays and downsizing of rental fleets (including the expected sell-off of a large number of Hertz’s units). In addition, lenders expect a significant increase in delinquencies and repossessions over the upcoming months as the economy continues to feel the effects of high unemployment. The number of accounts in ‘hardships’ jumped substantially in April and May across all risk groups, according to the Monthly Industry Snapshot by TransUnion: about 7% of all accounts were in hardship in May (double the April numbers and 18 times higher than a year ago). The number of ‘hardships’ increased across all risk tiers.
Due to these factors, we expect both wholesale and retail prices to deteriorate later in the summer. On the other hand, due to better than expected (but still very high) unemployment numbers, it is possible that the automotive industry will avoid a more catastrophic economic scenario (severe prolonged recession) that was considered as one of the scenarios in our residual value projections.
Although the economic effects of the pandemic will continue to be felt as far out as three years from now (e.g. according to the recent CBO economic outlook report, the unemployment rate will not return to pre-COVID levels for at least a decade), we still project that wholesale vehicle values will return to the pre-COVID-19 baseline by 2023. Used supply will decline due to cuts in retail and fleet sales throughout 2020 and into 2021.
CURRENT WHOLESALE MARKET OVERVIEW
Auction Insights
The lanes continued to be active this past week with strong prices and even stronger values. Sellers were holding firm to floors, leading to a few more no sales than the previous week, but the overall market continues to perform like a traditional spring/tax buying season.
The smaller buyers are having a hard time competing with the larger players, like Carmax and Carvana, in their efforts to re-stock their lots.
Even with the success that has been experienced with the digital platform, there are still many dealers we are hearing from that are ready for more auctions to offer physical auctions. In some cases, this is driving them to seek out independent auctions and more nontraditional channels to source inventory.
Limited staffing at auctions continues to cause heartburn for dealers in the form of inaccuracies in condition reporting and the lack of reconditioning the vehicles are receiving.
Auction Volume
Despite most auctions continuing to operate under an all-digital platform, sales volume has rebounded to a level consistent with, and on some days higher, than this time last year. This is being driven by strong retail sales and the need to backfill, which are then leading dealers to use auctions as their main source of inventory. The number of sales bottomed out around an 80% year-over-year decline when most auctions closed their physical sales (and some closed entirely) at the end of March.
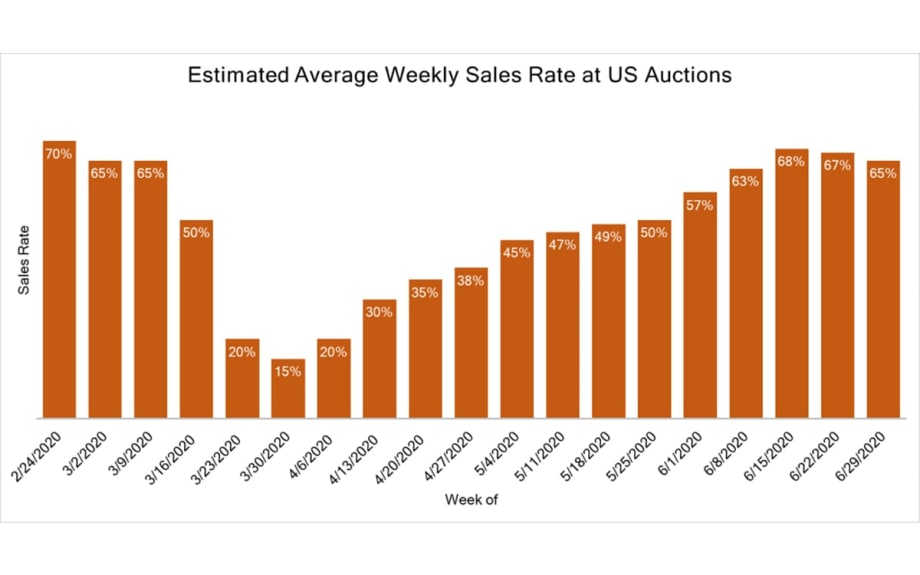
Sales Rate
At the onset of the pandemic, as shelter-in-place orders went into effect, sales rates quickly tumbled into the teens, but rates have been climbing each week and have now stabilized. Sellers are holding firm to floors, so no-sales are a bit more prevalent, but overall conversion rates are consistent with a springtime market. Black Book’s estimate of the Weekly Average Sales rate is presented below.
CURRENT WHOLESALE PRICE TRENDS
Current Market Level View
Volume-weighted, overall car segment values increased 1.19% this past week. All car segments experienced increases, with the most notable increase being the Compact Car segment at 1.59%. Near Luxury Car and Sporty Car segments also had large increases this past week at 1.40% and 1.34%. When volume-weighting is applied, the overall Truck segment (including pickups, SUVs, and vans) values increased by 0.73% last week with all segments increasing except Full-Size Vans. The Sub-Compact Crossover segment led the increases for the Truck/SUV segments at 1.88%. This segment was slow to rebound compared to the larger Compact Crossover segment but has led the increases for the last two weeks as the price point has made it an attractive purchase for buyers.
The graph below shows week-over-week depreciation rates for the entire market, including Cars and Trucks / SUVs / Vans for the last several months. Last week, the overall market appreciated by 0.90%. We have now experienced six weeks of overall market rebounding with consistent week-over-week increases in almost all segments.
Year-Over-Year View on Wholesale Prices
The graph above compares Black Book’s Seasonally Adjusted Retention Index for 2019 and 2020 calendar years. The Black Book Used Vehicle Retention Index is calculated using Black Book’s published Wholesale Average value on two- to six-year-old used vehicles, as a percent of original typically-equipped MSRP. It is weighted based on registration volume and adjusted for seasonality, vehicle age, mileage, and condition. The Index offers an accurate, representative, and unbiased view of the strength of used vehicle market values. It measures an ‘apples-to-apples’ year-over-year retention comparison.
2020 started slightly below 2019 levels, but the market showed early strength in February and March. As the US economy shut down due to the COVID-19 pandemic, we measured the highest single month drop in April of 6.9 points since launching the Index. As we entered July, wholesale prices continued the rebound that began during the second half of May and continued through the month of June, with June’s Retention Index climbing back to pre-COVID-19 levels with a record jump of 9.1 points.
During the last recession (2007-2009), the Index lost about 15 points in a span of 12 months before the recovery started. We project that during the current recession, the Index will decline over the next six months, but will start recovering afterwards in our most likely economic scenario. One of the main differences between this and the previous recession is the forced and abrupt shutdown of assembly lines and, as a result, significant reduction in projected used vehicle supply in 2021 and beyond.
Segment Highlight – Sub-Compact Cars
Segment Overview
The Sub-Compact Car (SBC) segment provides consumers a fuel-efficient and budget friendly option for commuting. As with many of the car segments, the market share has been shrinking over the last several years, down to 2% this year compared to 4% in 2007. Also like the other car segments, this is a segment in which the domestic manufacturers have been vacating, with the discontinuation of the Chevrolet Sonic and Ford Fiesta. The import brands have shown their commitment to this price leading segment with recent redesigns by Hyundai, Kia, and Nissan.
Historical Trends
Long term Retention Index
The Black Book Retention Index for the Sub-Compact Car segment has remained above the market level Index for most of the existence of our Index and this is in large part due to the price point it provides consumers. During the 2008/2009 recession, the segment level Index increased while the market and other segments were decreasing. This was largely due to the low price point and fuel-efficiency it afforded consumers. Much like the Index for the market and most other segments, the SBC Index also decreased by a large amount (6.3%) in April, down to 124.0. This is in comparison to the market level Index that decreased 6.9% to 106.7 in April. The segment and market level Index have rebounded with the SBC Index increasing 7.7% in June to 133.5, nearly back to the pre-COVID-19 level in February of 134.6.
Recent depreciation rates
Due to the fuel-efficiency of the Sub-Compact Car segment, the values in this segment tend to be sensitive to fluctuations in gasoline prices. At the onset of the pandemic when fuel prices were rapidly dropping, we saw the SBC and other fuel-efficient car segments, such as Compact Car and Mid-Size Car, decreasing at a faster rate than most other segments. The slightly larger Compact Car segment was much quicker to rebound, but SBC has been showing gains for the last three weeks.
USED WHOLESALE PRICE PROJECTIONS
Wholesale Price Impact Under the Most-Likely Economic Scenario
Wholesale prices dropped significantly in April as uncertainty over COVID-19 impact and response dampened vehicle demand, resulting in an overall wholesale price decline of 5.9% in April. We saw a substantial improvement in prices during the last two weeks of May and the monthly decrease was limited to only -1.5% in May. As we entered June, wholesale prices continued to increase, and the overall market appreciated by a record 5.7% in June. As a comparison, last year’s prices declined by 0.9% over the same period.
Black Book’s July Published Residual Values (dashed lines) reflect a new economic reality. Once the temporary strengthening in June passes, we project the values to stay below pre-COVID-19 forecast over the next two years, with the deepest declines expected over the next six months. The green line represents our most-likely economic scenario, which does not include a possible second wave of COVID-19, as well as a still yet undefined second stimulus package. A more severe and prolonged recessionary scenario is shown in red. Projections are indexed to the pre-COVID-19 projections (black line). All values are weighted by the used vehicle sales volume (actual, where available, or projected).
Short-Term Outlook (Summer / Fall of 2020)
We project a drop in wholesale prices compared to a pre-COVID-19 baseline this summer/fall, as the US economy suffers through the effects of COVID-19. We anticipate that later this summer and fall, wholesale prices will be between 10% and 15% lower than originally projected before the pandemic, due to a glut in supply and much weaker demand. Prices will start to recover in 2021 as the economy becomes stronger. We also anticipate that older (>6-year-old), cheaper vehicles in average condition will not decline as much due to increased demand for these units. Additionally, we project that newer (zero- to one-year old models) will retain their strength in the near future due to continuous shortage of new inventory.
Long-Term Projections (36-Month Residual Values, Summer / Fall of 2023)
The effects of the pandemic will continue to be felt, but we continue to project that values will return to the pre-COVID-19 baseline as used supply will decline as a result of cuts in retail and fleet sales throughout the remainder of 2020 and into 2021.
Wholesale Price Impact Under a Severe Recession Scenario
In this scenario, we project a drop in wholesale prices of about 20% later in the summer and fall, compared to a pre-COVID-19 baseline, with a slow recovery in 2021. The effects of the pandemic and recession will still be impactful in 36 months, and we project a 10% market level decline of wholesale prices as compared to pre-COVID-19 projections for the second half of 2023.
RETAIL VERTICAL
Retail Prices
In the age of proliferation and ‘no-haggle pricing’ for used-vehicle retailing, asking prices accurately measure the trends in the retail space. From the peak in early April until the end of June, retail listing prices decreased by about 4%. Since the second week of June, we saw a temporary stabilization of retail prices fueled by higher consumer demand due to stimulus payments and federal Paycheck Protection Program (PPP). We expect retail prices to continue their decline later in the summer as stimulus payments are exhausted and the protection in PPP expire.
Dealers Insights
The biggest headlines this past week were the Q2 sales results, and it was no surprise that sales were down for almost all manufacturers. New car sales were limited in April but heated up in May and June with enticing incentives. Even with the success for many dealers in May and June, the limited inventory left dealers unable to catch up to 2019’s Q2 volume.
Dealers are continuing to source inventory to restock, but we are hearing from many that they are starting to see a bit of a slowdown in foot traffic, especially in new vehicle sales, due to a lack of inventory and the pullback from manufacturers on early released COVID incentives. We’ve heard that the people that were going to buy with those incentives have already bought.
As we start off the month of July, many dealers are hopeful to start to receive larger shipments of new inventory as manufacturing should be back to full capacity later this month.
This past week, Ford announced its latest incentive, not in the form of cash on the hood, but in the form of job loss protection. Its latest program to entice buyers to its products allows the customers to return their purchased or leased vehicle if they lose their job within a year, following in the steps of the successful Hyundai Assurance plan, originally released during the last recession.
Retail vs. Wholesale Trends
Each week, members of the Black Book automotive analyst team, data science team and executive leadership team speak with no less than 30 dealers, along with buyer and seller representatives, wholesalers and others, who represent hundreds of franchise and independent dealers nationwide. These industry experts, along with experts we speak with from leading fleet management and rental car companies, auction leadership, and other industry experts, help to clarify and connect the dots between the wholesale and retail markets, adding to the insights our data reveals
Since the start of the pandemic, we have been observing different trends in wholesale and retail prices. In April and May, wholesale prices declined at a higher rate compared to retail prices. As margins grew, dealers reported healthy profits on a per vehicle basis. Retail prices displayed stickiness on the way down. Similarly, as wholesale prices came roaring back to pre-COVID-19 levels, retail prices are slow to recover, exhibiting the same stickiness on the way up. As wholesale to retail margins shrink, it is even more important for dealers to stay up to date on market movements. We are seeing this trend play out on dealership lots, where retail asking prices are not increasing at the same levels as wholesale transaction prices. This means dealers are paying more at auctions and through wholesale channels, but those increased wholesale acquisition prices, as a percentage, are not flowing through to the retail lots and online listings, and ultimately the consumer. The main driver of the slow increase in retail prices based on our conversations with dealers, is simply fear—fear of sitting on inventory for too long and the market making a quick reversal, which leaves them stuck with a vehicle they paid too much for. Dealer sentiment is quite clear—if they are going to pay up for a vehicle in this environment, they are choosing to turn them quickly, even with less margin than normal, to ensure they are not caught with high priced inventory when the market does shift. There is no long game here. There is simply a need to fulfill demand in a risk filled environment.
The graph below shows this retail / wholesale dynamic since the start of the year. Prices are indexed to the first week. For example, if a vehicle at the beginning of the year with typical mileage had a value of $10,000 retail and $8,000 wholesale (a $2,000 margin), then the same vehicle would be $9,460 retail and $8,460 wholesale (a $1,000 margin) last week.
NEW VEHICLES SALES OUTLOOK
Our New Sales Outlook remains unchanged from last week. We anticipate a significant reduction in US new vehicle sales in 2020 (both retail and fleet sales) due to continued reduction in consumer demand. This is a result of several ongoing factors, including less miles driven due to remote work and shelter-in-place initiatives, high unemployment, and an overall feeling of uncertainty by consumers. Overall, new sales were down 23% during the first six months of the year, compared to last year (with a 27% YOY decline in June as most states started to lift shelter-in-place orders). Even as OEMs are restarting assembly lines, there are significant challenges ahead in order to return to a normalized production schedule as we reported in previous updates. US manufacturers are planning to get back to pre-COVID-19 levels in July at the earliest as new production protocols and supply chain disruption slowed down the re-opening. The graph below shows our current projections for new vehicles sales for the rest of 2020.
Due to continuous production disruption and much weaker demand due to economic slow-down, we project a 25% drop (compared to pre-COVID-19 projections) in new sales in 2020 to 12.7mm units in our base economic scenario. In a deep economic recession scenario, we project a 40% drop in new sales in 2020 to 10.2mm units as economy dips into a prolonged recession.
USED VEHICLE SUPPLY PROJECTIONS
Black Book projects a higher than expected used vehicle supply in the wholesale marketplace for the rest of 2020 due to several factors:
Delayed lease returns resulting from lease extensions offered by OEMs – more than 560,000 additional three-year-old units
Extensive de-fleeting by rental car companies, due to lack of consumer and business traveler demand and financial pressure to raise cash – at least 250,000 one- to two-year-old vehicles
Dramatic reduction in auction activities due to COVID-19 in March, April, and May
Increased repossessions due to deteriorating economic conditions in addition to delayed repossessions in April / May
Short Term Lease Return Projections
When we started the year, lease returns were projected to hit a record volume of above 4.1 million units. Once the pandemic was underway and most manufacturing stopped, OEMs started to encourage lease extensions in order to push returns further into 2020 when they would be able to provide replacement vehicles. As a result, we project at least 560,000 additional units in the second part of 2020 (compared to the pre-COVID-19 estimates) due to a slowdown in sales in April / May, along with expected turn-ins of the lease extensions.
Rental Unit Returns
Business and leisure travel collapsed at the end of March. We expect a significant reduction in both categories for the remainder of 2020. In addition, there is no expectation that travel will return to pre-COVID-19 levels over the next several years. According to IATA (The International Air Transport Association), air travel will not return to pre-COVID-19 levels until after 2023. This puts tremendous financial pressure on rental companies that rely on air travel, to reduce both their current fleet and scrutinize future vehicle acquisitions. At the end of May, Hertz filed for bankruptcy in North America as a result of the pandemic.
In addition to Hertz, we expect other rental companies will continue to reduce their fleet during the summer and fall months to match lower demand for rentals. This practice will lead to over 250,000 additional rental units hitting the wholesale market over the next six months. Note that this is a base case scenario in which rental companies (excluding Hertz) can gradually reduce their fleet instead of a rapid-fire sale.
Longer Term Used Returns Projections
With the reduction in retail and fleet sales over the next several years, we project approximately 75k used units per month less in the market in 2023, compared to previously projected returns. This lower level of used inventory will be beneficial to used car prices as supply will be limited, helping to bolster valuations.
More Showroom

Affordable, Safe Cars for Teen Drivers
Families looking to balance affordability and safety in vehicles for their teen drivers can look to the updated list of recommended vehicles by IIHS and Consumer Reports.
Read More →
Auto Dealers Feel Better But Not Great
A second-quarter Cox Automotive poll of franchised retailers and independents found better views of the current market after a good spring but anticipation of third-quarter storminess.
Read More →
Holman Opens Porsche Dealership in Miami
The North Miami store features the brand’s signature Destination Porsche design concept, combining contemporary architecture and technology to create what the auto group calls an ultra-luxury experience.
Read More →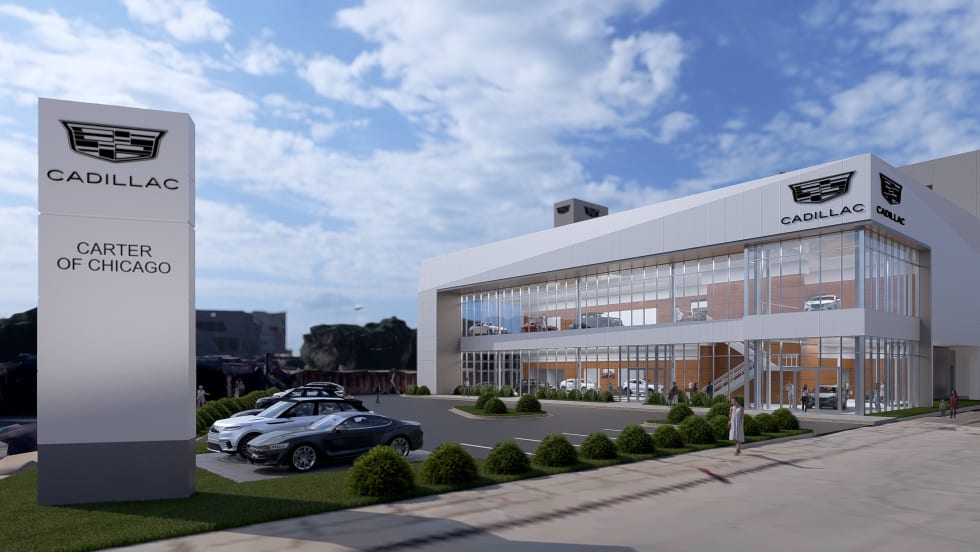
Chicago to Gain Cadillac Rooftop in 2027
The two-story Cadillac dealership is being constructed at the former Lincoln Yards site, owned and operated by Canada-based Jack Carter Auto Group.
Read More →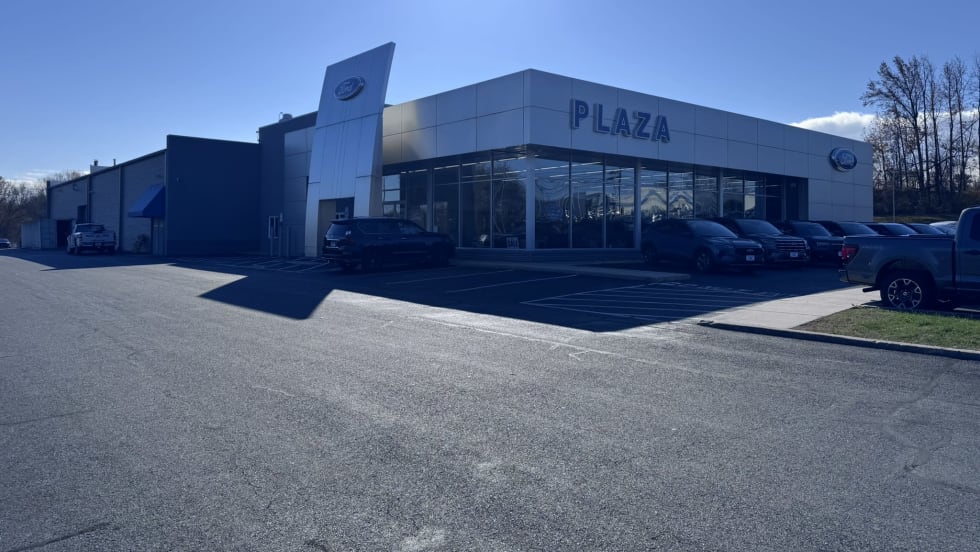
Mid-Atlantic Ford Store Has New Owner
A growing Maryland automotive group is only the 93-year-old dealership’s third owner after its longtime proprietors retired.
Read More →
Porsche Dealership Breaks Ground in Illinois
Barrington Porsche will be the new location for Murgado Automotive Group’s existing Porsche dealership currently in the Motor Werks of Barrington auto mall.
Read More →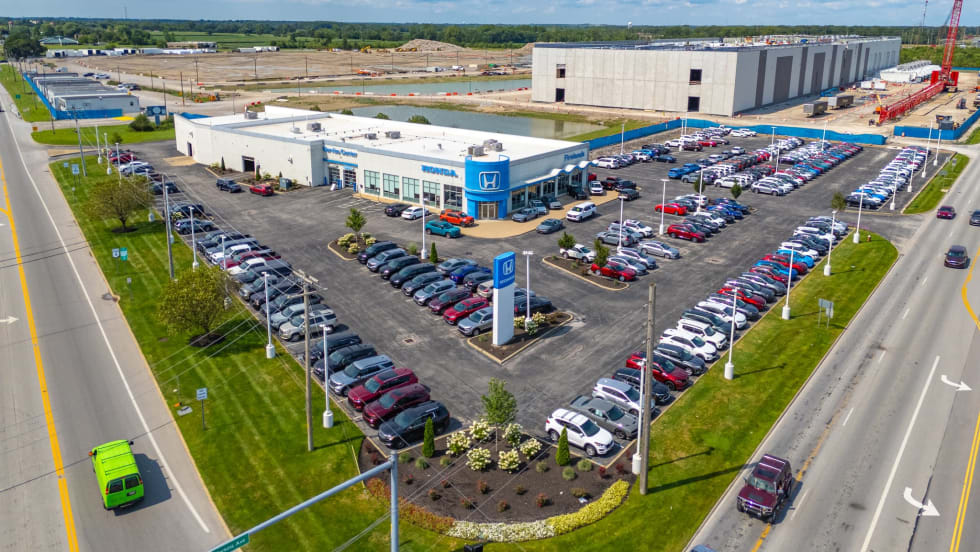
Michigan Auto Group Acquires Ohio Rooftops
Feldman Automotive Group added two new brands, Honda and Toyota, to its portfolio with its latest acquisition of four Fireside dealerships in Ohio.
Read More →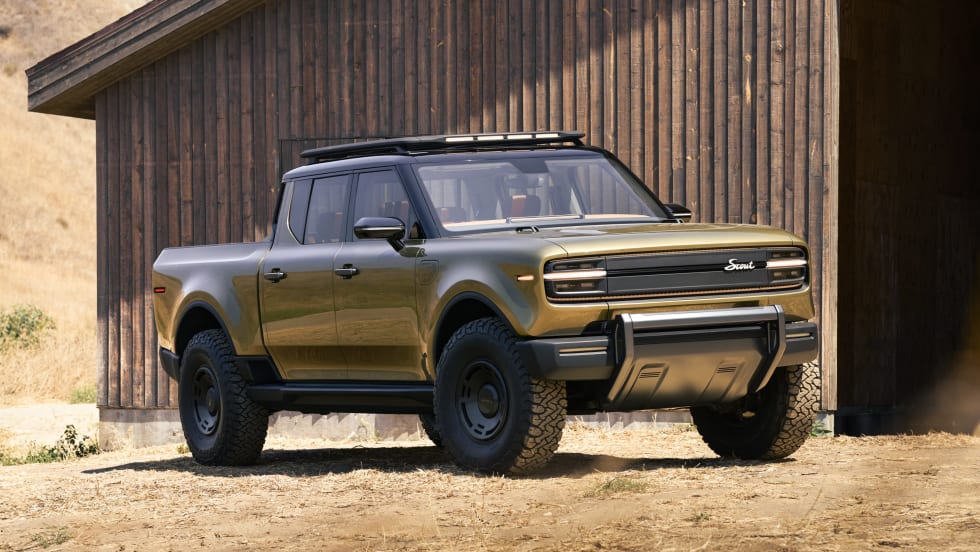
California VW Dealers Go After Scout
The franchisees’ state-level actions follow a California auto dealers trade group lawsuit against the VW affiliate last year, both efforts to stop the EV maker’s plan to sell direct to consumers.
Read More →
EVs Gain Traction in Europe
First-quarter auto sales increased as more consumers took advantage of government incentives. Hybrid deliveries are leading the way on the electrifieds boom.
Read More →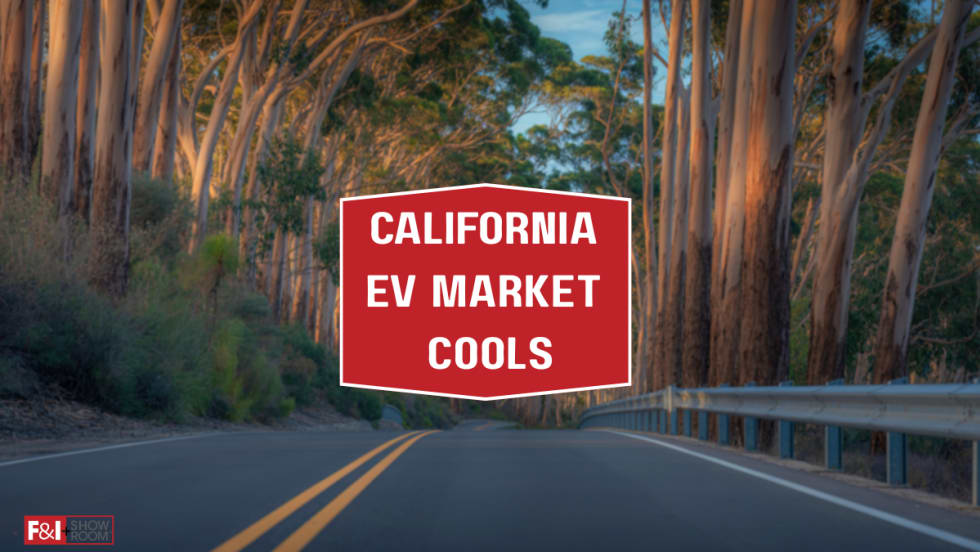
California Holds EV Lead Despite Annual Decline
At nearly 14%, California had the lowest zero-emission vehicle market share in the first quarter since the fourth quarter of 2021, according to the California New Car Dealers Association.
Read More →