
COVID-19 Market Report
Black Book recently published an update to their weekly COVID-19 Market Insights report.

Black Book recently published an update to their weekly COVID-19 Market Insights report.
Here is a quick recap of industry related headlines over the last week:
Wholesale prices continued to decline last week, for the fourth week in a row. Full-Size Trucks showed signs of softening, with the rate of increase slowing to 0.02% last week, compared to 0.12% the prior week.
Outside of the Full-Size Trucks segment, the depreciation rates for other mainstream segments in September are higher than we have seen in the previous years.
Average retail listing prices of available inventory declined last week.
Used retail listing volume increased last week but remains at levels significantly lower than last year – about 5% below a year ago, and 18% below where the industry started the year.
Weekly initial unemployment claims declined slightly in last week’s DOL report, but still remain above levels during previous recessions. Note that these numbers will be revised in two weeks as California stopped processing claims for the two week period.
September unemployment rate was at 7.9% – a small decline from August, according to the Labor Department. The job recovery slowed down significantly in the last two months. Another stimulus package may need to be passed in order to accelerate the recovery.
Black Book’s September Retention Index increased slightly in September due to exceptional strength of the Full-Size Pickup segment. All other major segments declined in September.
September’s Index of Consumer Sentiment from the University of Michigan increased slightly from August, but stayed well below pre-COVID levels.
The Federal Reserve released its quarterly economic projections, which showed a better economic outlook compared to its June projections. The most notable improvement was in the median projection for unemployment in 2021; it declined to 5.5% from 6.5% in June.
TransUnion released August’s Monthly Industry Snapshot which showed improvements in the number of accounts in hardship, as most of the lenders ended their deferral/forbearance programs. The largest improvement came from prime and super prime tiers, where consumers resumed paying their monthly payments. The overall number of accounts in hardship is still about 800% above 2019 level.
Last Week’s Highlights from the Wholesale Market
Volume-weighted, overall Car and Truck segments both experienced continued softening in values with the overall market decreasing by –0.36% this past week (compared to –0.25% the prior week). As for specifics, the overall Car segments decreased –0.66% (compared to –0.37% the prior week), and the overall Truck and SUV segments decreased this past week at a rate of –0.19% (compared to a decrease of –0.18% the prior week).
The graph below shows week-over-week depreciation rates for the entire market, including Cars and Trucks/SUVs/Vans for the last several months. We also show an average weekly change from several previous years (grey line).
News from the Retail World (Used and New)
Retail demand remains strong on Full-Size Trucks and large SUVs, with some truck inventory having days’ supply well under 30 days. The low levels of new inventory, particularly on those trucks, continues to give strength to the retention of certain models. However, smaller SUVs and sedans have seen demand weaken in recent weeks.
Retail prices have been on a continual climb since July, but this past week the trend reversed direction as the number of active used retail listings increased and the overall average used retail listing price declined. For many dealers, the goal continues to be to move volume and find other ways to make money on a deal. For example, through the financing, or extended warranties given that large gross profit margins are becoming harder to obtain.
Q3 sales results reflected the increase in new inventory that many dealers received over the last few months and subsequently, the consumer demand that led to some of the manufacturers experiencing strong sales results to end the quarter. For example, Kia, Mitsubishi, Mazda, and Volvo all showed gains in Q3 over 2019 Q3 results. However, all manufacturers are still down compared to 2019 year to date results.
Genesis previewed their latest crossover product offering last week, the GV70. It is the smaller sibling of the recently launched GV80. The previewed vehicle was still wrapped in camouflage, but it is expected to go on sale next year as a 2022 model year.
Ford announced last week they will be lowering the price of their highly anticipated Mustang Mach-E crossover, that is expected to launch later this year. Some trims are getting a price cut of as much as $3,000.
What Comes Next?
We are starting to see an incremental influx of used inventory coming to the marketplace that we expect to last into the first half of 2021, resulting from prolonged lease return delays. It seems that most of these vehicles never make it to auctions, as grounding dealers keep the inventory for retail sales. In addition, lenders re-started the process of repossessions as the economy continues to feel the effects of high unemployment. With much weaker retail demand, and a projected oversupply of used inventory, we forecast a significant drop in wholesale prices this fall and winter, relative to the heights seen in recent months.
Longer Term View
Although the economic effects of the pandemic will continue to be felt as far out as three years from now (e.g. according to the July’s CBO’s economic outlook report, the unemployment rate will not return to pre-COVID levels for at least a decade and the recent Federal Reserve projections in September show unemployment above 4% for the foreseeable future), we still project that wholesale vehicle values will return to at least the pre-COVID-19 baseline by 2023. Used vehicle supply will decline significantly due to cuts in lease and fleet (both rental and commercial) sales throughout 2020 and into 2021.
Economic Conditions
Job Market
The graph above compares weekly initial unemployment claims from the current recession against the Great Recession of 2007 – 2009. The severity and speed of job losses during this crisis is unprecedented. The horizontal (x) axis is an offset (in months) from the beginning of the recession, with week 0 being the week of March 21st.
Last week, the Labor Department reported that the US added 870,000 new jobless claims – a slight decline from the week prior.
Since March, we have seen 28 consecutive weeks of record layoffs and furloughs, indicating that businesses are still struggling to start full recovery.
In the early stages of the crisis, the US unemployment rate in April skyrocketed to 14.7%, the highest monthly rate since the Great Depression.
The May unemployment level decreased to 13.3% due to the success of the Federal Paycheck Protection Program (PPP) and other stimulus measures enacted in part by the Federal Reserve and Government.
As the country and the economy continued to reopen during the early part of June, the monthly unemployment numbers eased further to 11.1% and dropped to 10.2% in July.
In August, we saw further improvement in the labor market as the unemployment rate fell to 8.4%.
The September unemployment number dropped to 7.9% mostly due to exit of large number of people from the employment pool. Additionally, job gains slowed down significantly.
The Labor Bureau also noted in its reports that there was a classification error in its surveys, and the real unemployment numbers were actually higher for each month since March, as illustrated above.
There is concern that without further federal stimulus, these gains will be temporary and employment numbers may deteriorate.
This recession is very different and unprecedented in the labor market – reflecting an almost instantaneous jump in unemployment with projected fast growth and recovery within several years. The graph above compares unemployment rates for the last several major recessions. The horizontal (x) axis is an offset (in months) from the beginning of the recession.
Although we have seen a reduction in unemployment claims, the initial economic shock and job losses have created a deep hole for us to dig ourselves out of. Between February and the end of August, the nation lost close to 10.7 million jobs.
Consumer Confidence
Not surprisingly, consumer confidence has been on a rollercoaster over the last six months.
At the beginning of the year, sentiment was strong – the University of Michigan’s Monthly Consumer Sentiment Index in February was at 101 points.
As the COVID-19 pandemic spread across the US, the Index dropped to 71.8 points in April and increased slightly to 72.3 points in May.
During testimony by the Federal Reserve Chair, Jerome Powell, he noted that during the months of April and May, “stimulus checks and unemployment benefits are supporting household incomes and spending.”
With these one-time stimulus payments and extended unemployment benefits helping the economy, the Index for June increased further to 78.1. The gains, however, were not uniform across the country. With a significant reduction in the number of COVID-19 cases, the Northeast region led the way with a record 19.1 point month-over-month jump, while the Southern region rose just 0.5 points due to the dangerous increase in numbers of new infections and fear of further shutdowns.
With a weakening of the economy and the increase in new COVID-19 cases across the South, consumer confidence retracted to the lows of April in July. The University of Michigan’s Monthly Consumer Sentiment Index for July decreased to 72.5 points and increased slightly in August to 74.1.
The September Index increased further to 80.4, but still remains heavily depressed compared to pre-COVID and last September’s numbers.
Gross Domestic Product (GDP)
The Bureau of Economic Analysis published the third estimate of GDP in the second quarter (as of September 30th) – real GDP decreased at an annual rate of 31.4%. This was the highest drop in GDP ever recorded.
Consensus states that the economy will start to grow in the third quarter, as compared to the previous one. The current “nowcast” from the GDP Now model [from the Federal Reserve] estimate for real GDP growth (seasonally adjusted annual rate) in the third quarter of 2020 was 34.6% on October 1st.
Delinquencies in Automotive Lending
The number of accounts in ‘hardship’ jumped substantially in April, and kept increasing through June across all risk groups, according to the Monthly Industry Snapshot by TransUnion. The numbers stabilized in July and improved in August – currently, about 4.3% of all accounts are in hardship – this is roughly an 800% increase over last year. The increases are across all risk tiers. As deferrals expire in the upcoming month, coupled with a high unemployment rate, lenders expect a large portion of these ‘hardships’ to become delinquencies.
According to the “Senior Loan Officer Opinion Survey on Bank Lending Practices” from the Federal Reserve, lenders started to tighten standards on auto loans during the first half of 2020. Board of Governors of the Federal Reserve System released results from the third quarter that showed a substantial increase in the number of banks that have tightened their standards.
Gas Prices
Gasoline prices reversed the May trend and then started to increase. Since their lowest point at the end of April, prices are up $0.41, to $2.17 per gallon last week, a one cent drop from the prior week, according to the U.S. Energy Information Administration.
Current Wholesale Market Overview
Auction Insights
Sales results continued to be mixed this past week, with some sellers adjusting floor prices and ready to move their inventory, and others holding firm to floors and willing to experience high no sale rates. In particular, the luxury sellers are holding firm to floors and seeing sales rates falling in the 20% range. Full-Size Trucks and large SUVs continue to bring strong attention on the lanes.
Many remarketers we are talking to are letting us know that they are short on inventory, and are prepared to ride out the traditional fall softening in the market. The only big adjustments they are making to floors are in their older, rougher inventory and on sedans where demand is low.
The big buyers (Carmax, Carvana, etc.) continue to be active at the auctions, but their zealous bidding and buying throughout the summer months has been slowing down for the past couple of weeks. Their need to be the final bidder, no matter the cost, appears to have lessened. This past week we saw more independents being the successful bidder. This is a welcome sight as we’ve talked to so many buyers that struggled over the summer to compete with the money the larger buyers were willing to spend to secure inventory.
Auction Operations Update: Manheim Atlanta, Manheim Georgia, Manheim New Mexico, and Manheim Birmingham resumed in-lane bidding through Manheim’s Digital Block this week. Cars are still not driving across the lanes, but buyers are able to be in-lane with a live auctioneer.
Auction Volume
Over the last several weeks we have seen the wholesale sold volume decrease as dealers started to pull back on purchasing.
The drops in volume were not uniform across all auctions and platforms.
The graph below illustrates the estimated year-over-year change in the monthly sold volume in the wholesale market. The summary includes all major wholesale channels including open auctions (digital and physical), dealer-to dealer platforms, direct to dealer sales, etc.
Sales Rate
At the onset of the pandemic, as shelter-in-place orders took effect, sales rates quickly tumbled into the teens.
Subsequently, rates began climbing each week before finally stabilizing in June and July.
After months of consistently strong sales, much of seller’s best inventory has been sold and retail demand is softening in certain segments. As a result, sales rates have started to decline.
Black Book’s estimate of the overall Weekly Average Sales rate is presented below.
Current Wholesale Price Trends
Current Market Level View
Volume-weighted, overall Car segment values decreased -0.66% over the last week, an increase in depreciation compared to the –0.37% experienced the week prior.
The small car segments, Compact and Sub-Compact, had the largest car segment declines this week as demand has softened in recent weeks with new inventory increasing and consumers continuing to shift their preferences to crossovers.
Premium Sporty Cars continued to show stability with a minimal 0.04% increase last week, compared to 0.00% the prior week.
When volume-weighting is applied, the overall Truck segment (including pickups, SUVs, and vans) values declined -0.19% last week, marginally higher than the previous week decrease of –0.18%.
Both Sub-Compact and Sub-Compact Luxury suffered large declines this past week. Fuel prices remain low, so these fuel-efficient segments are being passed over by consumers for the larger compact and mid-size segments that provide more utility and passenger space.
Full-Size Trucks continued to lose steam in the amount of increase this past week. Three weeks ago, the increase was 0.54%, followed by 0.12% two weeks ago, and then this past week the increase was only 0.02%. At the auctions last week, it was observed that some trim levels showed weakening in values and it is expected that this will continue into this week. However, new inventory remains low so it is not expected that values will experience large declines until new supply increases.
Black Book’s Seasonally Adjusted Retention Index
The graph above compares Black Book’s Seasonally Adjusted Retention Index for the 2019 and 2020 calendar years. The Black Book Used Vehicle Retention Index is calculated using Black Book’s published Wholesale Average value on two- to six-year-old used vehicles, as a percent of original typically equipped MSRP. It is weighted based on registration volume and adjusted for seasonality, vehicle age, mileage, and condition. The Index offers an accurate, representative, and unbiased view of the strength of used vehicle market values. It measures an ‘apples-to-apples’ year-over-year retention comparison.
2020 started slightly below 2019 levels, but the market showed early strength in February and March.
As the US economy shut down due to the COVID-19 pandemic, we measured the highest single month drop in April of 6.9 points since launching the Index.
As we entered July, wholesale prices continued the rebound that began during the second half of May and continued through the month of June, with June’s Retention Index climbing back to pre-COVID-19 levels with a record jump of 9.1 points.
Black Book’s July Index value jumped above 2019 to 126.0 points as wholesale prices continued their climb.
August Retention Index jumped further to 129 points – the highest retention level ever recorded since the inception of the Index in 2005.
Our September index came at 130.8 – 1.4% increase from August and 12.8% higher than in 2019. Market strength was driven mostly by the Full-Size Pickup segment.
Our “nowcast” for October shows a decline in Index to about 127 points.
During the last recession (2007-2009), the Index declined by about 15 points in a span of 12 months before recovery started. We project that the Index will decline over the next five months after experiencing the summer’s strength. The graph below shows the historical trends in Black Book Retention Index that covers the last 15 years including the Great Recession.
Used Wholesale Price Projections
Wholesale Price Impact Under the Most-Likely Economic Scenario
2020 In Review
The wholesale market started the year strong from January through March, as prices increased during the first quarter.
Wholesale prices dropped significantly in April, as uncertainty over COVID-19’s impact and response dampened vehicle demand. This resulted in an overall wholesale price decline of 5.9%.
We saw a substantial improvement in prices during the last two weeks of May as many states re-opened their economies, and the monthly decrease was limited to only -1.5%.
During the summer months, demand in the automotive market was fueled by federal government stimulus and delayed tax season. Additionally, used and new inventory shortages drove wholesale prices up.
In June, wholesale prices continued to increase, and the overall market appreciated by 5.7%. As a comparison, last year’s prices declined by 0.9% over the same period.
Wholesale prices increased by a record 7.0% in July.
Wholesale prices continued their ascent in August and increased by an additional 2.7%.
Prices started to decline in the first week of September and by the end of the month declined by 1.0%. Performance varied by segment with the strength coming from Full-Size Pickup (which increased by 1.2%).
Short-Term Outlook
The graph above shows a market level weighted average projected (dashed lines) and historical (solid line) wholesale values for all 2017 model year models. The green line represents our most-likely economic scenario, which does not include a possible second wave of COVID-19, as well as a still undefined second stimulus package. A more severe and prolonged recessionary scenario is shown in red.
We project a drop in wholesale prices this Fall, as the US economy suffers through the effects of COVID-19 and due to a glut in supply. Prices will start to recover in 2021 as the economy becomes stronger.
We also anticipate that older (>6-year-old), cheaper vehicles in average condition will not decline as much due to increased demand for these units.
Long-Term Projections (36-Month Residual Values, Fall of 2023)
The effects of the pandemic will continue to be felt out to 36 months from now. We project that values will return to the pre-COVID-19 baseline as used supply will decline due to cuts in retail and fleet sales throughout the remainder of 2020 and into 2021.
Used Retail Vertical
Used Retail Prices
With the proliferation of ‘no-haggle pricing’ for used-vehicle retailing, asking prices accurately measure trends in the retail space.
From the peak in early April, until the end of June, retail listing prices decreased by about 4%.
Since the second week of June, we have seen an increase in used retail prices fueled by higher consumer demand due to stimulus payments, the federal Paycheck Protection Program (PPP), and limited used and new inventory.
Since early August, used retail prices rebounded to above pre-COVID-19 levels.
We expect used retail prices to decline later in the fall as demand will decline in the absence of stimulus payments during a weak economy.
Used Retail Inventory
Many dealers continue to report a shortage of used inventory in the wholesale marketplace. As a result, from the peak in February, we have seen a decline in the number of used retail listings by between 20% and 25%. Current inventory level is about 20% below where we started the year.
The true shortage of vehicles is probably not as severe as this decline would lead you to believe, as many dealers sell some of their best inventory in the first several days before listing them online. Nevertheless, the shortage of used inventory helps keep retail prices elevated even in the weak economic conditions.
The graph above shows the weekly average of the number of retail listings collected by Black Book, indexed to the first week of the year. We see a continuous decline in the numbers starting at the beginning of May as the economy started to open in the states outside of the Northeast.
The graph below shows year-over-year change in average monthly retail listings.
We started 2020 with active retail listings above previous year’s levels.
By July, the listing volume dropped to about 7% below 2019 numbers.
August saw another drop in listed inventory to about 9% below 2019.
In September, inventory listings continued to grow and were about 6% below 2019.
Currently, the number of listings is about 5% lower compared to last year.
Used Retail vs. Wholesale Prices Trends
Each week, members of the Black Book automotive analyst team, data science team and executive leadership team speak with no less than 30 dealers, along with buyer and seller representatives, wholesalers and others, who represent hundreds of franchise and independent dealers nationwide. These industry experts, along with experts we speak with from leading fleet management and rental car companies, auction leadership, and other industry experts, help to clarify and connect the dots between the wholesale and retail markets, adding to the insights that our data reveals.
Since the start of the pandemic, we have been observing different trends in both wholesale and retail prices (see graph below).
In April and May, wholesale prices declined at a higher rate compared to retail prices. As margins grew, dealers reported healthy profits on a per vehicle basis. Retail prices displayed stickiness on the way down.
Similarly, as wholesale prices came roaring back to pre-COVID-19 levels in July and August, retail prices were slow to recover, exhibiting the same stickiness on the way up.
As the wholesale market started to decline in September, we began to experience the early stages of our expectations that both wholesale and retail prices will decline significantly over the next four months.
The graph below captures this retail / wholesale dynamic since the start of the year. Prices are indexed to the first week. The black line is Black Book’s Retention Index (not adjusted for seasonality). It is calculated using Black Book’s published Wholesale Average value on two- to six-year-old used vehicles, as a percent of original typically equipped MSRP. It is weighted based on registration volume and adjusted for vehicle age, mileage, and condition. The blue line is a retail index – average listing price of available retail inventory adjusted for mileage.
New Vehicles Sales Outlook
We still anticipate a significant reduction in US new vehicle sales in 2020 (both retail and fleet sales) due to continued reduction in consumer demand. This is the result of several ongoing factors, including less miles driven due to remote work and shelter-in-place initiatives, high unemployment, and an overall feeling of uncertainty by consumers.
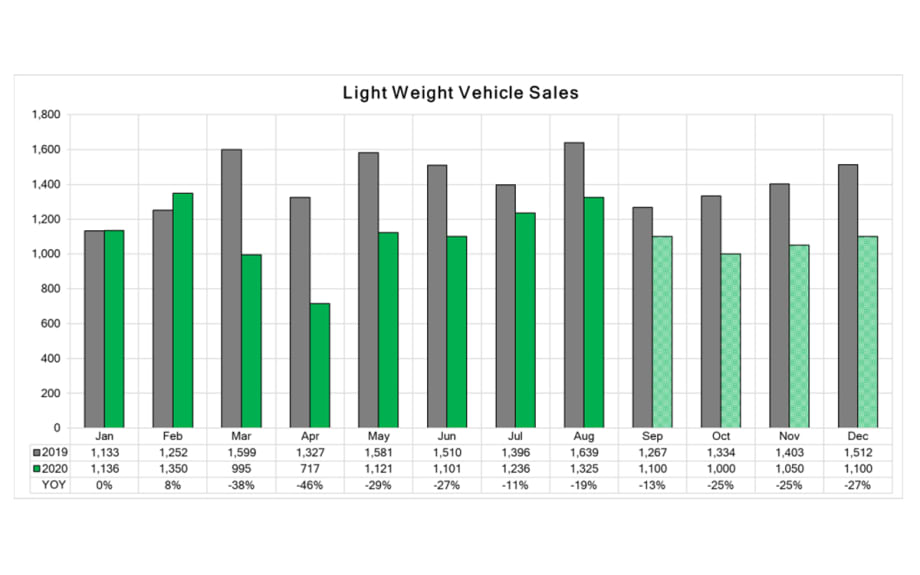
Overall, new vehicle sales were down 21.5% during the first eight months of the year compared to last year (with a 19% YOY decline in August). The graph below shows our current projections for new vehicles sales for the remainder of 2020.
Our New Vehicle Sales Outlook was updated based on stronger than expected August sales numbers. Due to continuous production disruptions and much weaker demand due to the economic slow-down, we project a 22% drop (compared to pre-COVID-19 projections) in new sales in 2020 to 13.2mm units in our base economic scenario.
In the longer-term, we expect new sales volume to return to pre-COVID-19 levels within five years.
Used Vehicle Supply Projections
Black Book projects a higher than expected used vehicle supply in the wholesale marketplace for the rest of 2020 due to several factors:
Delayed lease returns resulting from lease extensions offered by OEMs – more than 560,000 additional three-year-old units in the second half of 2020.
Extensive de-fleeting by rental car companies due to lack of consumer and business traveler demand and financial pressure to raise cash – at least 250,000 one- to two-year-old vehicles will be added to the market in the second part of 2020.
Dramatic reduction in auction activities due to COVID-19 in March, April, and May.
Increased repossessions due to deteriorating economic conditions in addition to delayed repossessions during spring and summer months – we expect the volume of repossessed vehicles to at least double in the next six months compared to last year. This additional volume could exceed 1.0 million additional units in the next 6 months.
Short Term Lease Return Projections
When we started the year, lease returns were projected to hit a record volume of above 4.1 million units. Once the pandemic was underway and most manufacturing stopped, OEMs started to encourage lease extensions in order to push returns further into 2020, when they would be able to provide replacement vehicles. As a result, we project at least 560,000 additional units in the second part of 2020 (compared to the pre-COVID-19 estimates) due to a slowdown in sales in April / May, along with expected turn-ins of the lease extensions.
Repossessions
About 1.9 million vehicles were repossessed by lenders and sold (mostly) through wholesale channels in 2019. During the beginning of the pandemic, most states put a moratorium on auto repossessions and most lenders had deferral programs to help owners through the first several months of the recession. According to the American Financial Services Association, as of the end of August, only Maryland and Washington, DC still had a moratorium in place. Most of the lenders have ended their deferral programs. Our survey of lenders and automotive recovery companies suggest that the volume of repossessed vehicles will at least double in the next six months. We expect that there will be substantial challenges at every step of the process as recovery, transportation, and disposal are not fully recovered.
Rental Unit Returns
Business and leisure travel collapsed at the end of March – air travel is still down by more than 70% according to the TSA. We expect a significant reduction in both categories for the remainder of 2020. In addition, there is no expectation that travel will return to pre-COVID-19 levels over the next several years. According to the IATA (International Air Transport Association), air travel will not return to pre-COVID-19 levels until after 2023. This puts tremendous financial pressure on rental companies that rely on air travel to reduce both their current fleet and scrutinize future vehicle acquisitions.
At the end of May, Hertz filed for bankruptcy in North America as a result of the pandemic. Several weeks ago, Hertz was able to secure a deal with its lenders that allows a gradual reduction of fleet – over 182,000 units between June and December. In addition to Hertz, we expect other rental companies will continue to reduce their fleet during the fall months to match lower demand for rentals. This practice will lead to over 250,000 additional rental units hitting the wholesale market in the second half of 2020.
In the longer term (later 2021 – 2023), the drop in rental return volume will benefit the price of newer used units, as supply will be limited.
The graph below shows Black Book’s projections for rental returns. The purple line shows the difference between current (darker rectangles) and pre-COVID-19 projections (lighter rectangles).
Longer Term Used Returns Projections
With the reduction in retail and fleet sales over the next several years, we project a substantial decrease of available used inventory in the years to come. The graph below illustrates the numbers of returned vehicles up to 8-years-old. This lower level of used inventory will be beneficial to used car prices as supply will be limited, helping to bolster valuations.
More Auto Finance

New Cars a Tad More Affordable
May averages show that combined circumstances gave auto consumers slightly better buying power for the month, though average prices were up year-over-year.
Read More →
First-Quarter Sees Long Auto Loan Growth
Experian data show more consumers are tapping the method, along with refinancings, to afford buying. Meanwhile, subprime borrowers are getting more access.
Read More →
Mastering Credit Friction
In this video, Josh Krach explains how to turn credit friction into an advantage.
Read More →
April Less Affordable
Based on prices, reduced incentives and slower household income growth, consumers found it more challenging to buy new last month, Cox Automotive reported.
Read More →
Auto Lenders, Consumers on a Tightrope
April borrowing data shows that more consumers are bending over backward to buy vehicles, though subprime lending cooled off for the month.
Read More →
Toyota Financial Services President Replaced
Scott Cooke has served in various roles with Toyota Financial Services for over 20 years, including president and CEO, which he retires from on June 30.
Read More →
Permission or Approval: When to Notify Finance Sources
Credit card down payments, multiple vehicle purchases and even straw purchases can be completed without committing bank fraud, as long as you tell the bank first.
Read More →
At-Risk Auto Borrowers Drive Looser Credit Access
Cox Automotive’s index shows the subprime segment, long loan terms, negative-equity borrowers and down payment amounts all grew in February despite ever-higher vehicle prices.
Read More →
Auto Loan Forecast Bucks Market Trend
Auto loan originations rose over 6% year-over-year in the third quarter of 2025, but TransUnion predicts a slight decline in auto loan growth this year, making it an outlier in the company's overall lending forecast.
Read More →
Auto Credit More Plentiful
Growing access shows greater lender appetite for risk as consumers take on heavier debt burden in an inflated market.
Read More →