
Black Book: Weekly Market Report
Eleven of the 13 truck segments reported increases last week.

The rate of value gains is slowing.
IMAGE: Black Book
Wholesale Prices, Week Ending April 15th
Values continued to increase last week, but the rate of gain is slowing. In addition, auction conversion rates have been weakening, with sellers holding very firm on their floors. Auctioneers are having to work a little harder to get bidders in the game, with many lanes having fewer bidders tuning into their sale.
This Week Last Week 2017-2019 Average (Same Week)
Car segments +0.41% +0.52% +0.23%
Truck & SUV segments +0.27% +0.39% +0.04%
Market +0.31% +0.43% +0.12%
Car Segments
On a volume-weighted basis, the overall car segment increased +0.41%. For reference, in the previous week, cars increased by +0.52%.
Eight of the nine car segments increased last week.
Once again, in a sign of the time of year, the sporty car segment reported the largest gain last week, at +0.88%. The segment has averaged an increase of +0.93% over the last five weeks.
Prestige Luxury Car, at -0.41%, was the only segment to report a decline. It had been reporting slowing in depreciation in recent weeks, averaging only -0.04% per week over the last month, so last week’s decline was larger than the recent average.
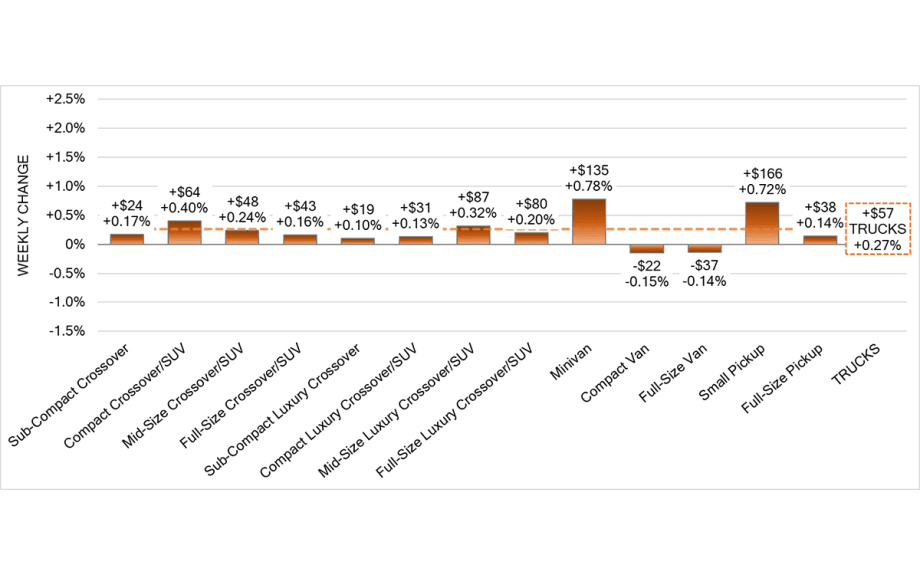
Truck / SUV Segments
The volume-weighted overall truck segment increased +0.27%, compared with the prior week’s increase of +0.39%.
Eleven of the 13 truck segments reported increases last week.
Continuing the trend in recent weeks, minivan reported the largest increase at +0.78%, but far less than the average of the prior three weeks of +1.36%.
Small pickup continues to gain momentum, reporting +0.72% last week, with an average weekly increase of +0.59% over the past four weeks.
Weekly Wholesale Index
The graphic below looks at trends in wholesale prices of 2- to 6-year-old vehicles indexed to the first week of the year. The index is computed keeping the average age of the mix constant to identify market movements.
Calendar years 2020 and 2021 ended with used wholesale prices at elevated levels. With economic patterns, including the automotive market, driven by the pandemic, normal seasonal patterns in the wholesale market, e.g., the 2019 calendar year, were not observed for most of the last three years. We saw a similar picture in 2009 at the end of the Great Recession. Calendar year 2021 did not have typical seasonality patterns, as the market had rapid increases in wholesale values for most of the year. The Wholesale Weekly Price Index reached the highest point of the year at the end of December 2021, reporting over 1.51 points. In 2022, the price index was on a mild rollercoaster until July, after which point prices were on a continuous decline until the end of the year.
Retail (Used and New) Insights
With the Shanghai Auto Show kicking off this week, we are looking forward to what will be unveiled. One that we know will be in store for us is the Polestar 4, a midsize crossover to compete with the Tesla Model Y.
Also in Shanghai, Mini will be debuting its concept for an all-electric subcompact crossover, the Aceman.
The Aston Martin DBS is getting a major revamp for 2023 and will be called DBS 770 Ultimate. This extremely limited version will have 759-hp and a price tag of more than $400,000 for the convertible. All 499 limited-edition coupe and convertibles are already sold.
In more electric news, the ID.7 has now been revealed, and the all-electric sedan that is scheduled to hit the U.S. market in 2024 as a 2025 model year will beat its crossover sibling, the ID.4, with its power ratings and range.
Used-Retail Prices
Used-retail prices are more accessible than in years past due to the proliferation of "no-haggle pricing" for used-vehicle retailing. Transparent pricing upfront makes the car-buying process more enjoyable for customers and allows Black Book to accurately measure retail market trends.At the onset of the pandemic, in CY2020, used-retail prices increased slightly, following typical seasonal patterns, and then began dropping in April, finally hitting a low point in the late spring months. By late summer of CY2020, used-retail prices increased as supply of new-vehicle inventory started to become scarce, but retail demand slowed at the end of CY2020, resulting in declining retail asking prices for the last several weeks of the year. When CY2021 kicked off, demand rebounded while retail prices slightly lagged wholesale prices; March 2021 started the dramatic increases in used-retail prices, fueled by stimulus payments, tax season, and shortages of new inventory. During the third quarter, retail prices continued to rise at a slower rate but soon picked up the pace once again to start the fourth quarter, when prices on retail listings steadily increased week after week. As CY2021 came to an end, the retail listing price index closed 36% above where the year began. The index remained relatively stagnant through most of CY2022. In the fourth quarter of 2022, Retail Listings Price Index declines started but were not as steep as the wholesale price index.
This analysis is based on approximately two million vehicles listed for sale on U.S. dealer lots. The graphic below looks at 2- to 6-year-old vehicles. The index is computed keeping the average age of the mix constant to identify market movements.
Inventory
Used Retail
The Used-Retail Active Listing Volume Index reverted to one at the start of 2023. Currently, the index sits at 0.95 points.
The used-retail days-to-turn estimate is currently around 56 days.
Wholesale
Auction conversion rates dropped slightly for the third straight week, and with prices reporting a slowing in the rate of increase, it leaves us wondering if the spring market is starting to come to an end. The general mood from those we’ve talked to is that we still have some weeks of increases ahead of us. As for this last week, sporty cr and small trucks saw the largest increases in values. Also, we have noticed the inventory at various OEM open and closed sales has been down the last few weeks, but inventory in the dealer lanes is increasing. As always, the Black Book team will continue to watch and report on developing trends.
The Estimated Average Weekly Sales Rate dropped slightly to 51% last week.
Originally posted on Auto Dealer Today
More Showroom

Affordable, Safe Cars for Teen Drivers
Families looking to balance affordability and safety in vehicles for their teen drivers can look to the updated list of recommended vehicles by IIHS and Consumer Reports.
Read More →
Auto Dealers Feel Better But Not Great
A second-quarter Cox Automotive poll of franchised retailers and independents found better views of the current market after a good spring but anticipation of third-quarter storminess.
Read More →
Holman Opens Porsche Dealership in Miami
The North Miami store features the brand’s signature Destination Porsche design concept, combining contemporary architecture and technology to create what the auto group calls an ultra-luxury experience.
Read More →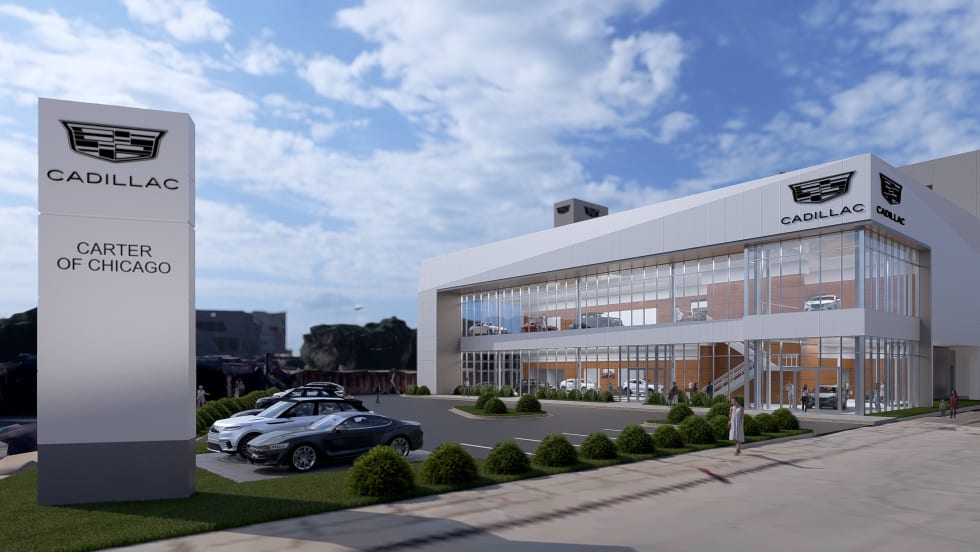
Chicago to Gain Cadillac Rooftop in 2027
The two-story Cadillac dealership is being constructed at the former Lincoln Yards site, owned and operated by Canada-based Jack Carter Auto Group.
Read More →
Mid-Atlantic Ford Store Has New Owner
A growing Maryland automotive group is only the 93-year-old dealership’s third owner after its longtime proprietors retired.
Read More →
Porsche Dealership Breaks Ground in Illinois
Barrington Porsche will be the new location for Murgado Automotive Group’s existing Porsche dealership currently in the Motor Werks of Barrington auto mall.
Read More →
Michigan Auto Group Acquires Ohio Rooftops
Feldman Automotive Group added two new brands, Honda and Toyota, to its portfolio with its latest acquisition of four Fireside dealerships in Ohio.
Read More →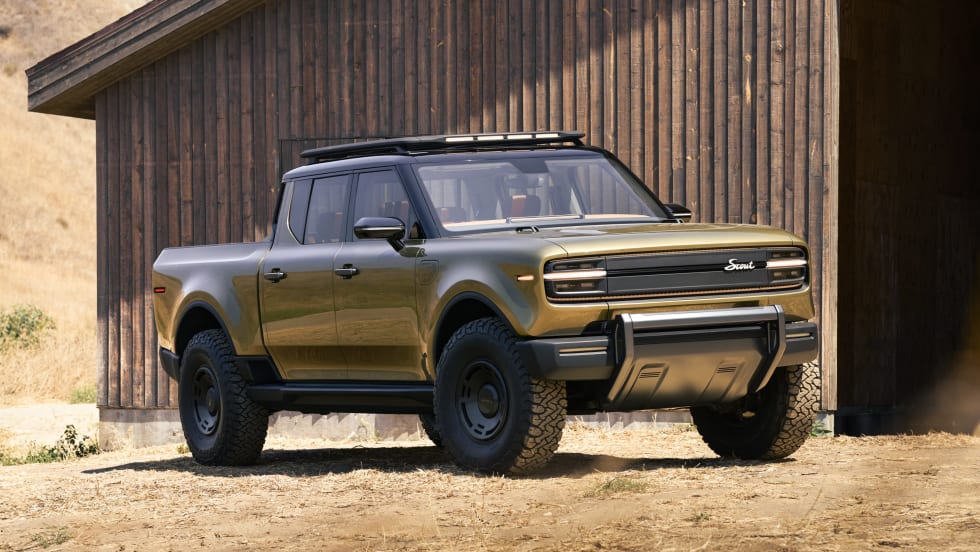
California VW Dealers Go After Scout
The franchisees’ state-level actions follow a California auto dealers trade group lawsuit against the VW affiliate last year, both efforts to stop the EV maker’s plan to sell direct to consumers.
Read More →
EVs Gain Traction in Europe
First-quarter auto sales increased as more consumers took advantage of government incentives. Hybrid deliveries are leading the way on the electrifieds boom.
Read More →
California Holds EV Lead Despite Annual Decline
At nearly 14%, California had the lowest zero-emission vehicle market share in the first quarter since the fourth quarter of 2021, according to the California New Car Dealers Association.
Read More →