


Don’t Fire Your Best F&I Manager
Looking to thin your F&I herd? Advanced analytics prove there are better ways to judge performance than PVR alone.
Your people make or break your business. Your weakest F&I manager costs you lost profit every month. They also cost you future streams of opportunity. It is inevitable that someone will be your worst performer. The only question is how to be sure if letting that person go will improve the department’s overall performance.
Let’s take a look at an example that proves your data can lead you to the wrong answer.
We Need to Talk
Let’s say you have five F&I managers. Bill appears to be the worst performer with an F&I profit per vehicle retailed (PVR) average of $657, compared to a department average of $856 average — a difference of $199. He worked 568 deals. You calculate that, if you fire Bill and give his work to the others, your profit will increase by $199 times 568 or $113,000.
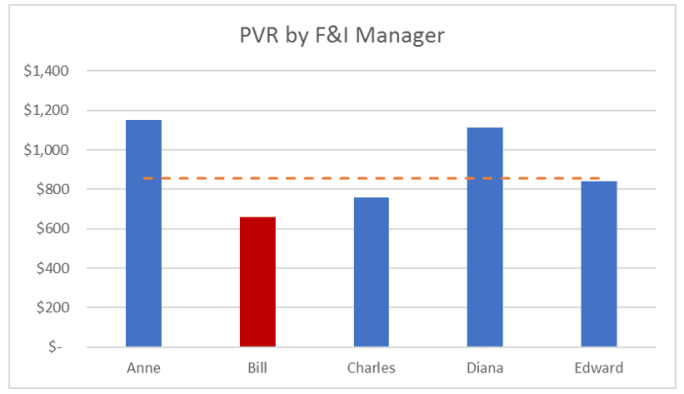
Time for Bill to go! … Or is it?
Let’s do a bit more analysis. When we look at your team’s PVR on a model-by-model basis, a different answer emerges. It turns out that Bill is the best performer for three vehicles!
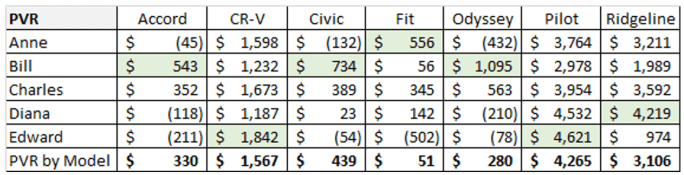
Why is it, then, that Bill has the worst PVR? The mix of deals that he does skews heavily toward ones in which he does best: Accord and Civic. These two happen to be the low-margin and high-volume vehicles for the dealership. The model mix drags down his PVR score.
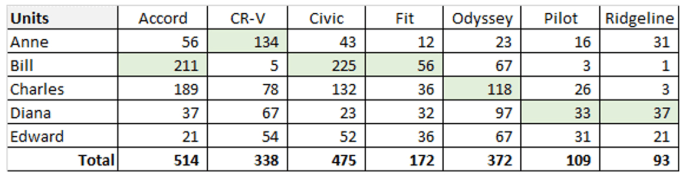
Let’s sharpen our pencil and figure out what would happen if we moved Bill’s deals to the others, but this time we account for the PVR by model. We find that PVR reduces for four models and improves for three.

The detailed analysis shows that the total profit would fall by $262,000. The estimated benefit of removing Bill turns out, on further analysis, to be a big loss. This is why you must always dig deeper.
It is difficult to see the combined impact of PVR mix and volume mix by model. F&I manager performance becomes a four-dimensional matrix, with manager, model, PVR and volume as the dimensions. How can we quickly see these four dimensions all together in a two-dimensional chart?
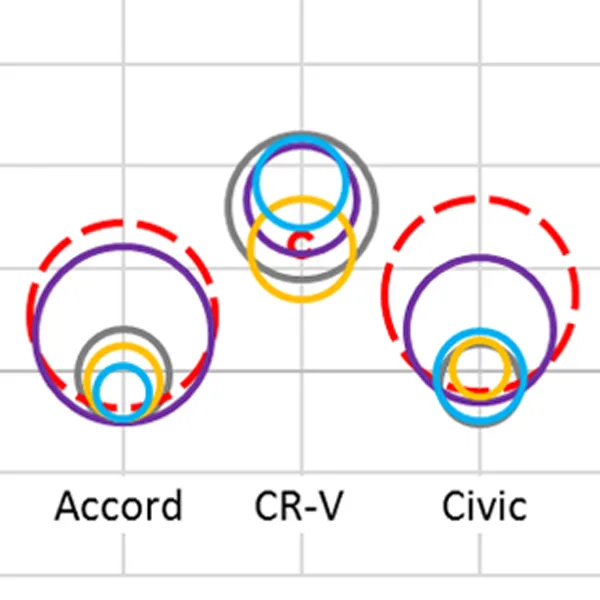
Hoop charts to the rescue! Instead of using a point, we can use a hoop whose size depicts another dimension of the data. The F&I manager becomes a color code. Now you can see the four-dimensional information contained in these tables in one view.
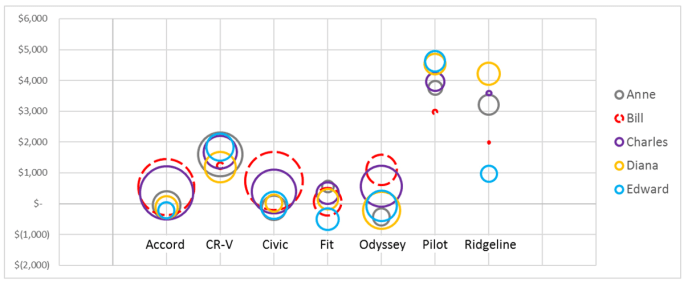
In the hoop chart, you can see that Bill rises to the top of the PVR chart for Accord, Civic and Odyssey. The size tells you that, if you burst those bubbles by removing Bill, the gross on those models will fall substantially as those hoops drop down to the average PVR for the remaining managers. The hoop for the Fit won’t move much. The tiny hoops for the CR-V, Pilot and Ridgeline will be outweighed by the big ones. The chart tells you to keep Bill.
Keep It Complicated
Removing or retraining poor performers is a big lever in the hands of a dealer or F&I director. Applying that lever correctly requires you to analyze performance data with great care. Business performance is multidimensional. Simplistic tools are not useful for critical decisions that impact employee morale, performance and loyalty.
I tailored this data to cast Bill in a bad light using the most common performance metric, and then to recast him as a good performer based on the detail. In real life, you must look at the key metrics and into the details before you make decisions. It takes time and effort to do calculations involving different tables, and it becomes difficult to do on an ongoing basis under work pressure. Automated performance monitoring gets you out of the “no time to calculate it” trap, and lets you make employee performance management decisions with confidence.
Rahul Saxena is the founder and chief analytics officer of FrogData. Contact him at rahul.saxena@bobit.com.
More F&I

AI: Facilitator, Not Fixer, in F&I
The dealerships that thrive in the years ahead will be those that embrace technology while continuing to invest in the people who make customer interactions count.
Read More →
Modern Technology Objection Handling
In this video, Trent White shares how to confidently handle technology-based objections by helping customers understand the value of protection, even with modern vehicle technology.
Read More →
Consistency at Scale: Driving F&I Performance
With 75 rooftops across the Sunshine State, Morgan Auto Group has proven to Floridians that it knows a thing or two about driving performance in a competitive market. But it didn’t start at the top.
Read More →
Gitty Up on GAP
The foundational finance-and-insurance product hasn’t kept up with the latest conditions for auto dealers. Is the time ripe?
Read More →
How AI-Powered Coaching Is Transforming F&I Performance
See how AI-powered coaching can turn F&I customer conversations into actionable insights that support compliance, performance and profitability
Read More →
Sell Value, Build Trust
In this video, Trent White explains why selling on value, not fear, builds lasting customer trust, reduces cancellations, and drives long-term success.
Read More →
F&I Sales Give Dealers First-Half Lift
Product business shored up total profits to avoid an overall revenue tanking as product penetrations held steady, StoneEagle reported.
Read More →
Targeted Training Drives Results
Today’s technology, instead of threatening F&I managers, can actually make them better, according to an industry veteran who’s watched market setbacks roil the unprepared.
Read More →
Double the Change, Double the Chance
When an F&I manager gets a customer refusal, it’s a wise move to tweak more than one thing in the product offering.
Read More →
Just Do It
F&I managers need training, but instead of resisting application or expecting perfection, they should improve by simply acting on what they learn.
Read More →