
Cash for Clunkers and Production Cuts Help Lower July Incentives, Says Edmunds.com
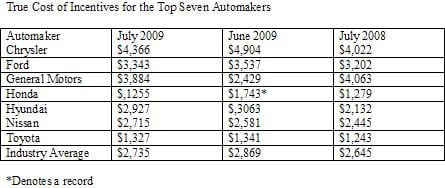
Edmunds.com estimated that the average automotive manufacturer incentive in the U.S. was $2,735 per vehicle sold in July 2009, down $134, or 4.7 percent, from June 2009, and up $90, or 3.4 percent, from July 2008. This represents the fourth consecutive month in which incentives have fallen.
SANTA MONICA, Calif. — Edmunds.com estimated that the average automotive manufacturer incentive in the U.S. was $2,735 per vehicle sold in July 2009, down $134, or 4.7 percent, from June 2009, and up $90, or 3.4 percent, from July 2008. This represents the fourth consecutive month in which incentives have fallen.
“Comparing June with July, incentives usually increase between $50 and $200 per car sold, but this year they are down $134 per car,” said Jessica Caldwell, manager of pricing and industry analysis for Edmunds.com. “The Cash for Clunkers frenzy has given automakers the opportunity to reduce their own investment in creating sales momentum, and to maximize profitability in the process.”
According to Edmunds.com, combined incentives spending for domestic manufacturers averaged $3,743 per vehicle sold in July 2009, up from $3,727 in June 2009. From June 2009 to July 2009, European automakers increased incentives spending by $282 to $3,504 per vehicle sold; Japanese automakers decreased incentives spending by $153 to $1,591 per vehicle sold; and Korean automakers decreased incentives spending by $136 to $2,927 per vehicle sold.
“Automakers cut production earlier this year to deal with lower sales volumes, not anticipating this sales activity midway through the year,” said Michelle Krebs, Senior Editor of Edmunds’ AutoObserver.com. “Which will run out first — clunker money or the replacement cars people want to buy?”
In July 2009, the industry's aggregate incentive spending is estimated to have totaled approximately $2.6 billion, up 5.6 percent from June 2009. Chrysler, Ford and General Motors spent an aggregate of $1.5 billion, or 56.6 percent of the total; Japanese manufacturers spent $640 million, or 24.5 percent; European manufacturers spent $275 million, or 10.5 percent; and Korean manufacturers spent $217 million, or 8.3 percent.
Among vehicle segments, premium sport cars had the highest average incentives, $7,074 per vehicle sold, followed by premium luxury cars at $4,402. Subcompact cars had the lowest average incentives per vehicle sold, $1,371, followed by compact cars at $1,824. Analysis of incentives expenditures as a percentage of average sticker price for each segment shows large cars averaged the highest, 12.9 percent, followed by large trucks at 12.7 percent of sticker price. Premium luxury cars averaged the lowest with 5.4 percent and sport cars followed with 5.9 percent of sticker price.
Comparing all brands, in July Scion spent $294 followed by smart at $394 per vehicle sold. At the other end of the spectrum, Cadillac spent the most, $6,165, followed by Hummer at $5,891 per vehicle sold. Relative to their vehicle prices, Pontiac and Hyundai spent the most, 18.9 percent and 15.9 percent of sticker price, respectively; while Scion spent 1.7 and Lexus spent 2.7 percent.
More F&I
Integrating Nontraditional F&I Products
The niche presents a strategic advantage for auto dealerships as they move to adapt to fast-changing consumer expectations in today’s market.
Read More →
Trust Is Personal
Technology, no matter how efficient, can’t replace what the human F&I manager can do, which is to bridge the divide between cyberspace and the in-store experience.
Read More →
Amplify 2026 Billed as Turning Innovation Into Results
Reynolds and Reynolds says its annual retail summit will connect dealers with practical strategies, peer insight, and technology-driven ideas.
Read More →
Own Your Outcome: F&I in the Digital Customer Journey
Finance has historically been the last step in the car-buying process, but it doesn’t have to be. The customer’s journey starts long before they arrive at the dealership, and so should F&I’s involvement.
Read More →
Tariffs Could Raise Insurance Premiums
As U.S. import tariffs affect repair costs, consumers might find it more affordable to replace a damaged vehicle, according to recent Insurify tariff analysis.
Read More →
Smaller Loans, Longer Terms
The youngest generation of car buyers is more likely to finance less expensive vehicles, more than half of generation Z consumers borrowing less than $25,000.
Read More →
New Lifetime Battery F&I Product Meant to Drive Dealer Traffic
EFG Cos. offering is intended to create lifetime auto dealer engagement with customers.
Read More →
The Psychology Behind Menus That Increase Add-On Sales
There is a science to crafting a menu that gives customers confidence in the choices presented, and moving the process outside the F&I office can further boost results.
Read More →
Why Your F&I PVR Is Misleading You
Here’s a handy checklist of the numbers to track in 2026 instead.
Read More →
Auto Consumer Anxiety Presents Opportunity
A survey of U.S. drivers found the majority are concerned about finances and the economy, but those fears make many ready to buy vehicle-protection products.
Read More →