


Edmunds.com Reports Large SUVs are the Most Subsidized Vehicles in the Industry
Edmunds.com (www.edmunds.com), an online resource for automotive information, reported that the average manufacturer incentive per vehicle sold in the United States was $2,624 in June 2003, up $654 or 33.2 percent from June 2002 and up 3.6 percent or $92 from May 2003. Industry average "days-to-turn," which measures how many days on average it takes to sell a vehicle after it hits the dealer's lot, remained constant from last month at 69 days, but was up from last June's 55 days.
Edmunds.com says its monthly True Cost of Incentives (TCI) report takes into account all of the manufacturers' various United States incentives programs, including subvented interest rates and lease programs as well as cash rebates to consumers and dealers. To assure the greatest possible accuracy, Edmunds.com bases its calculations on sales volume, including the mix of vehicle makes and models for each month, as well as on the proportion of vehicles for which each type of incentive was used.
The company says incentives spending for domestic Chrysler, Ford and General Motors nameplates averaged a record high $3,516 per unit in incentives in June, compared to $1,898 for European automakers, $1,369 for Korean automakers, and $1,030 for Japanese automakers.
Chrysler had the biggest increase in incentives spending in June, up 14.2 percent to $3,494. Despite this jump in incentives, the U.S. market share for Chrysler fell 0.3 percent to 13.5 percent in June. Ford increased incentives spending by 1 percent for the month, to $3,252 per unit, and saw its market share inch up 0.2 percent to 19.4 percent. General Motors' increased its incentives spending 0.9 percent for the month, to $3,708 per unit, while its market share increased 1.6 percent to 28.5 percent in June, its highest level since December 2002.
According to the company, by vehicle segment, large SUVs had the highest average incentives this month at $3,829, followed by large cars at $3,478 and large trucks at $3,299. Luxury SUVs had the lowest average incentives at $1,270, with sports cars at $1,645 and compact SUVs at $1,716. Compact cars gained the most market share, up 0.7 percent to 15.5 percent, while midsize SUVs lost the most market share, down 0.5 percent to 12.7 percent.
"Because consumers are becoming less responsive to traditional incentives, many manufacturers are trying to break new ground by offering matching down payments, longer terms for low APR programs, subsidized leases, 24-hour test drives and higher rebate amounts," stated Dr. Jane Liu, executive director of data analysis for Edmunds.com. "However, there are certainly some exceptions where manufacturers with strong brands have produced highly desired vehicles; the new Toyota Sienna, Volkswagen Touareg and Lexus RX 330 are all having great sales success with virtually no incentives."
About Edmunds.com True Cost of Incentives (TCI)
Edmunds.com's TCI is a comprehensive monthly report that measures automobile manufacturers' cost of incentives on vehicles sold in the United States. These costs are reported on a per vehicle basis for the industry as a whole, for each manufacturer, for each make sold by each manufacturer and for each model of each make. TCI covers all aspects of manufacturers' various incentives programs (except volume and similar bonus programs), including dealer cash, manufacturer rebates and consumer savings from subvented APR and lease programs (including subvented lease residual values used in manufacturer leasing programs). Data for the industry, the manufacturers and the makes are derived using weighted averages and are based on actual monthly sales and financing activity.
About Edmunds.com, Inc.
Edmunds.com is an online resource for automotive information. Its comprehensive set of data, tools and services, including Edmunds.com True Market Value® pricing, is generated by Edmunds Data Services and is licensed to third parties. For example, the company supplies over 800,000 pages of content for the auto sections of AOL and NYTimes.com, provides weekly data to Automotive News and delivers monthly data reports to Wall Street analysts. The company is headquartered in Santa Monica, California and maintains a satellite office in Troy, Michigan.
More F&I

How AI-Powered Coaching Is Transforming F&I Performance
See how AI-powered coaching can turn F&I customer conversations into actionable insights that support compliance, performance and profitability
Read More →
Sell Value, Build Trust
In this video, Trent White explains why selling on value, not fear, builds lasting customer trust, reduces cancellations, and drives long-term success.
Read More →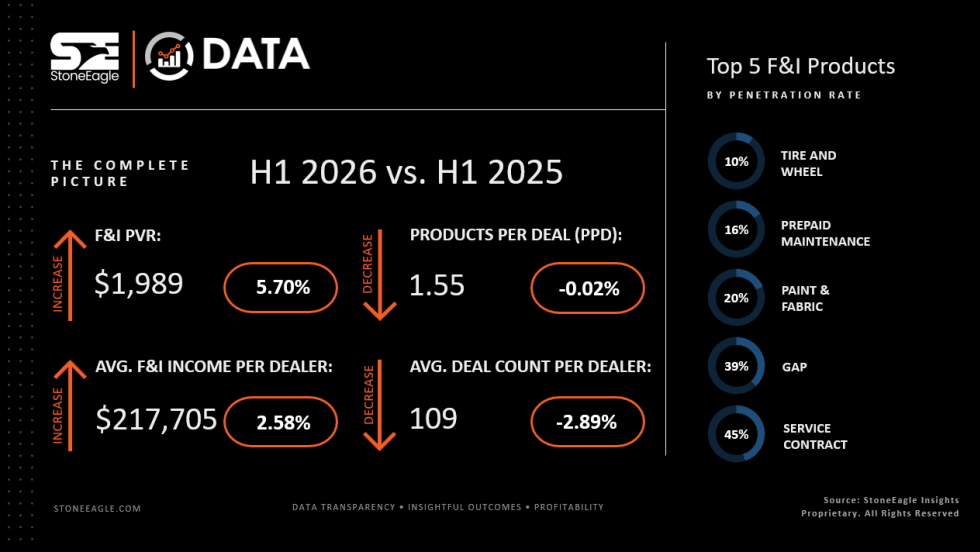
F&I Sales Give Dealers First-Half Lift
Product business shored up total profits to avoid an overall revenue tanking as product penetrations held steady, StoneEagle reported.
Read More →
Targeted Training Drives Results
Today’s technology, instead of threatening F&I managers, can actually make them better, according to an industry veteran who’s watched market setbacks roil the unprepared.
Read More →
Double the Change, Double the Chance
When an F&I manager gets a customer refusal, it’s a wise move to tweak more than one thing in the product offering.
Read More →
Just Do It
F&I managers need training, but instead of resisting application or expecting perfection, they should improve by simply acting on what they learn.
Read More →
Dealer Lender Preferences Revealed
When lenders provide consistent, fast service, their overall satisfaction scores with dealers greatly improve, according to JD Power research.
Read More →
Leading with Purpose
In this video, Trent White explains how understanding your people’s 'why' is a key leadership responsibility of F&I professionals and how that mindset drives dealership engagement, trust and performance.
Read More →
Integrating Nontraditional F&I Products
The niche presents a strategic advantage for auto dealerships as they move to adapt to fast-changing consumer expectations in today’s market.
Read More →
Trust Is Personal
Technology, no matter how efficient, can’t replace what the human F&I manager can do, which is to bridge the divide between cyberspace and the in-store experience.
Read More →