



TransUnion: Auto Delinquencies Fall to Record Low for Second Straight Quarter
Despite growing auto debt, the majority of states and cities are experiencing declines in their auto delinquency rates, which fell to a new low for the second consecutive quarter.
CHICAGO — For the second consecutive quarter, the national auto loan delinquency rate hit its lowest level since TransUnion began tracking the data in 1999.
Auto loan delinquency rates in the second quarter dropped to 0.33 percent, down from 0.36 percent the first quarter. On a year-over-year basis, auto loan delinquencies declined 25 percent from 0.44 percent in the second quarter 2011, according to TransUnion.
"It's not surprising that auto loan delinquencies remain at record low levels," said Peter Turek, automotive vice president in TransUnion's financial services business unit. "A recent TransUnion study found that consumers now value their auto loans more than their credit cards and mortgages. This is partly due to the need for transportation to get to work or to seek employment in a difficult job market.
“Additionally, consumers with car loans have more equity in their vehicle than they have in the recent past because of the strong used car vehicle market. Consumers want to keep their auto loan relationships in good standing,” he added.
In addition to increased demand in new and used autos, bank auto debt per borrower has risen nearly 6 percent from $12,689 in the second quarter 2011 to $13,427 in the recent quarter. Despite growing bank auto debt, the majority of states and cities are experiencing declines in their auto loan delinquency rates.
Between the first and second quarter of this year, 37 states experienced declines in their auto delinquency rates. On a more granular level, 58 percent of metropolitan areas realized decreases in their auto delinquency rates in the second quarter. This is down from the prior period where 66 percent of MSAs experienced decreases.
"It's impressive to see auto loan delinquencies remain so low despite a growing proportion of new loans going to non-prime consumers," Turek added.
On a year-over-year basis, the percentage of new auto loans made to nonprime borrowers (with a VantageScore credit score lower than 700 on a scale of 501-990) in the second quarter increased by 9 percent. In the last two years (between Q2 2010 and Q2 2012), the percentage of new auto loans to nonprime borrowers has increased more than 20 percent.
"With the increase in non-prime borrowing, we do anticipate that auto loan delinquencies will begin to increase," Turek said. "We are at such a low auto loan delinquency level — far from normal standards — that a slight rise through the end of the year should be expected, though the overall rate will likely remain relatively low."
Q2 2012 Bank Auto Statistics - Delinquency Rates
Quarter over Quarter | Q1 2012 | Q2 2012 | Pct. Change | |||||||
USA | 0.36 | % | 0.33 | % | (8.33 | %) | ||||
Year over year | Q2 2011 | Q2 2012 | Pct. Change | |||||||
USA | 0.44 | % | 0.33 | % | (25.00 | %) | ||||
Highest Bank Auto Delinquency States | Q2 2012 | ||
Louisiana | 0.60 | % | |
Mississippi | 0.60 | % | |
Oklahoma | 0.55 | % | |
Bank Auto Delinquency in Key States | Q2 2012 | ||
California | 0.37 | % | |
Florida | 0.41 | % | |
Illinois | 0.39 | % | |
Michigan | 0.21 | % | |
New York | 0.30 | % | |
Texas | 0.36 | % | |
Top 3 Year-over-Year Increases | Q2 2011 | Q2 2012 | Pct. Change | |||||||
Delaware | 0.31 | % | 0.45 | % | 45.16 | % | ||||
Idaho | 0.19 | % | 0.26 | % | 36.84 | % | ||||
Montana | 0.24 | % | 0.25 | % | 4.17 | % | ||||
Q2 2012 Bank Auto Statistics - Bank Auto Debt Per Borrower
Quarter over Quarter | Q1 2012 | Q2 2012 | Pct. Change | |||||||
USA | $ | 13,272 | $ | 13,427 | 1.17 | % | ||||
Year over Year | Q2 2011 | Q2 2012 | Pct. Change | |||||||
USA | $ | 12,689 | $ | 13,427 | 5.82 | % | ||||
Highest Bank Auto Debt Per Borrower | Q2 2012 | |||
Texas | $ | 15,232 | ||
Louisiana | $ | 14,973 | ||
Alabama | $ | 14,960 | ||
Lowest Bank Auto Debt Per Borrower | Q2 2012 | |||
Nebraska | $ | 11,614 | ||
Ohio | $ | 11,965 | ||
Kansas | $ | 12,154 | ||
Top 3 Year-over-Year Increases | Q2 2011 | Q2 2012 | Pct. Change | |||||||
Oregon | $ | 11,788 | $ | 13,094 | 11.07 | % | ||||
Louisiana | $ | 13,662 | $ | 14,973 | 9.60 | % | ||||
Idaho | $ | 11,382 | $ | 12,471 | 9.57 | % | ||||
Top 3 Year-over-Year Declines | Q2 2011 | Q2 2012 | Pct. Change | |||||||
New Jersey | $ | 13,953 | $ | 13,888 | (0.46 | %) | ||||
Hawaii | $ | 14,658 | $ | 14,615 | (0.29 | %) | ||||
Note: Only two states experienced year-over-year declines
More F&I

Modern Technology Objection Handling
In this video, Trent White shares how to confidently handle technology-based objections by helping customers understand the value of protection, even with modern vehicle technology.
Read More →
Consistency at Scale: Driving F&I Performance
With 75 rooftops across the Sunshine State, Morgan Auto Group has proven to Floridians that it knows a thing or two about driving performance in a competitive market. But it didn’t start at the top.
Read More →
Gitty Up on GAP
The foundational finance-and-insurance product hasn’t kept up with the latest conditions for auto dealers. Is the time ripe?
Read More →
How AI-Powered Coaching Is Transforming F&I Performance
See how AI-powered coaching can turn F&I customer conversations into actionable insights that support compliance, performance and profitability
Read More →
Sell Value, Build Trust
In this video, Trent White explains why selling on value, not fear, builds lasting customer trust, reduces cancellations, and drives long-term success.
Read More →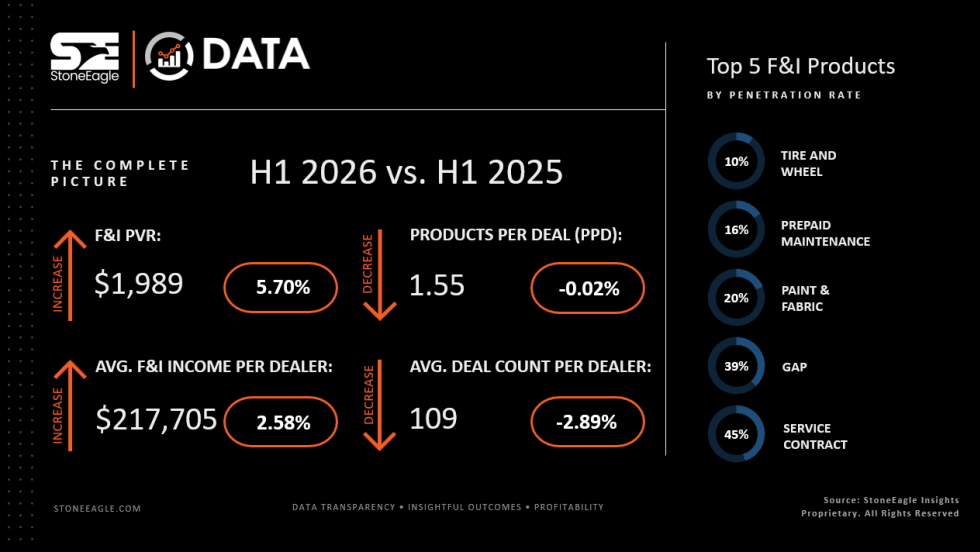
F&I Sales Give Dealers First-Half Lift
Product business shored up total profits to avoid an overall revenue tanking as product penetrations held steady, StoneEagle reported.
Read More →
Targeted Training Drives Results
Today’s technology, instead of threatening F&I managers, can actually make them better, according to an industry veteran who’s watched market setbacks roil the unprepared.
Read More →
Double the Change, Double the Chance
When an F&I manager gets a customer refusal, it’s a wise move to tweak more than one thing in the product offering.
Read More →
Just Do It
F&I managers need training, but instead of resisting application or expecting perfection, they should improve by simply acting on what they learn.
Read More →
Dealer Lender Preferences Revealed
When lenders provide consistent, fast service, their overall satisfaction scores with dealers greatly improve, according to JD Power research.
Read More →