
Model-Year Closeout Sales Slow in September
Edmunds.com estimated that the average automaker incentive in the U.S. was $2,576 per vehicle sold in September 2010, down $125, or 4.6 percent, from August 2010, and down $170, or 6.2 percent, from September 2009.
SANTA MONICA, Calif. — Edmunds.com estimated that the average automaker incentive in the U.S. was $2,576 per vehicle sold in September 2010, down $125, or 4.6 percent, from August 2010, and down $170, or 6.2 percent, from September 2009.
“Typically there is a significant increase in incentives spend from August to September, but that isn’t the case this year,” stated Edmunds.com Analyst Ivan Drury. “Interestingly, automakers are adopting very different incentives strategies even as they all try to hold down their incentives levels."
For example, in the past two months General Motors weighted incentives toward 2010 model year vehicles and it dramatically cleared out the old inventory; now only 48 percent of the company’s new-vehicle sales are 2010 model year. On the other hand, Toyota incentives average only $134 more for a 2010 model year vehicle than for a 2011 – and as a result 66 percent of its new vehicles sales are 2010s.
Edmunds.com estimates that in September, 64 percent of all new cars sold are from the 2010 model year and had an average incentive of $3,021, while 35 percent of new cars sold are from the 2011 model year and had an average incentive of $1,704. Last year at this time, 57 percent of new cars were from the 2009 model year and had an average incentive of $3,425, while 42 percent of new cars sold were from the 2010 model year and had an average incentive of $1,583.
According to Edmunds.com, combined incentives spending for domestic manufacturers averaged $3,204 per vehicle sold in September 2010, down from $3,441 in August 2010. From August 2010 to September 2010, European automakers decreased incentives spending by $229 to $2,294 per vehicle sold; Japanese automakers increased incentives spending by $12 to $2,119 per vehicle sold; and Korean automakers decreased incentives spending by $180 to $1,589 per vehicle sold.
True Cost of Incentives for the Top Six Automakers | |||
Automaker | September 2010 | August 2010 | September 2009 |
Chrysler Group | $3,036 | $3,270 | $4,289 |
Ford | $3,052 | $3,100 | $3,039 |
General Motors | $3,430 | $3,820 | $4,290 |
Honda | $1,755 | $1,731 | $893 |
Nissan | $2,874 | $2,971* | $2,546 |
Toyota | $2,212 | $2,193 | $1,515 |
Industry Average | $2,576 | $2,701 | $2,746 |
*Denotes a record
In September 2010, the industry's aggregate incentive spending is estimated to have totaled approximately $2.41 billion, down 10.1 percent from August 2010. Chrysler, Ford and General Motors spent an aggregate of $1.3 billion, or 55.7 percent of the total; Japanese manufacturers spent $765 million, or 31.7 percent; European manufacturers spent $180 million, or 7.5 percent; and Korean manufacturers spent $124 million, or 5.2 percent.
"Reports from the Paris motor show indicate that the auto industry is planning for a prosperous future, given that automakers are showing high-tech, green cars that are likely to have hefty price tags," noted AutoObserver.com Senior Editor Bill Visnic, who wrote an overview of “Mondial Auto 2010.”
Among vehicle segments, premium sport cars had the highest average incentives, $6,472 per vehicle sold, followed by premium luxury cars at $4,265. Subcompact cars had the lowest average incentives per vehicle sold, $1,122, followed by sport cars at $1,423. Analysis of incentives expenditures as a percentage of average sticker price for each segment shows large cars averaged the highest, 11.9 percent, followed by large trucks at 11.5 percent of sticker price. Sport cars averaged the lowest with 3.8 percent and premium luxury cars followed with 4.6 percent of sticker price.
Comparing all brands, in September smart spent the least, $211, followed by Subaru at $548 per vehicle sold. At the other end of the spectrum, HUMMER spent the most, $5,055, followed by Saab at $4,997 per vehicle sold. Relative to their vehicle prices, Saab and Chrysler spent the most, 12.9 percent and 12.5 percent of sticker price, respectively; while smart spent 1.3 and Audi spent 1.8 percent.
More F&I

Trust Is Personal
Technology, no matter how efficient, can’t replace what the human F&I manager can do, which is to bridge the divide between cyberspace and the in-store experience.
Read More →
Amplify 2026 Billed as Turning Innovation Into Results
Reynolds and Reynolds says its annual retail summit will connect dealers with practical strategies, peer insight, and technology-driven ideas.
Read More →
Own Your Outcome: F&I in the Digital Customer Journey
Finance has historically been the last step in the car-buying process, but it doesn’t have to be. The customer’s journey starts long before they arrive at the dealership, and so should F&I’s involvement.
Read More →
Tariffs Could Raise Insurance Premiums
As U.S. import tariffs affect repair costs, consumers might find it more affordable to replace a damaged vehicle, according to recent Insurify tariff analysis.
Read More →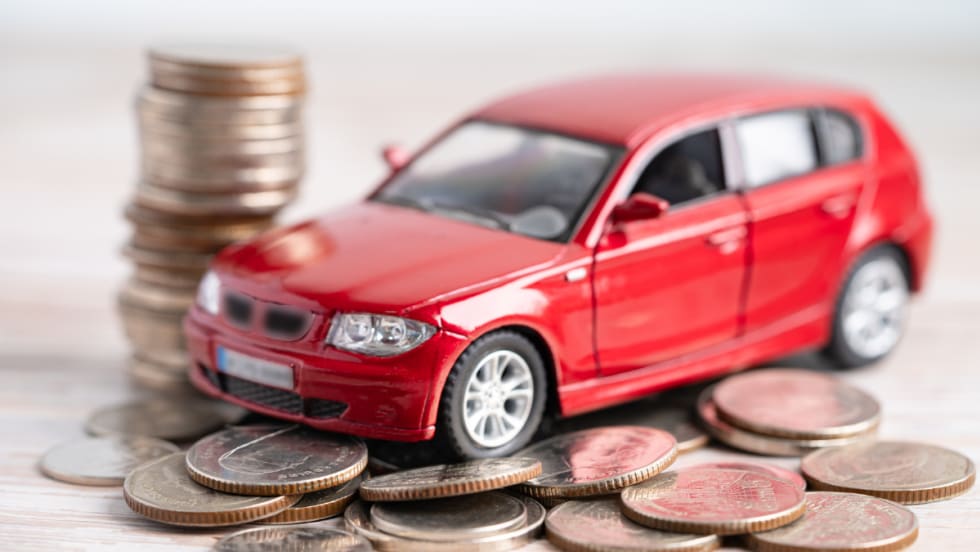
Smaller Loans, Longer Terms
The youngest generation of car buyers is more likely to finance less expensive vehicles, more than half of generation Z consumers borrowing less than $25,000.
Read More →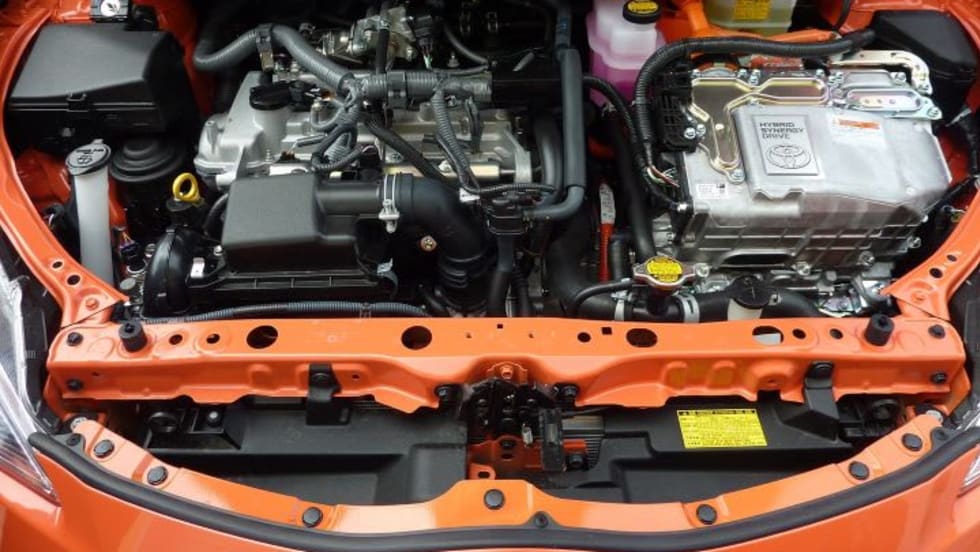
New Lifetime Battery F&I Product Meant to Drive Dealer Traffic
EFG Cos. offering is intended to create lifetime auto dealer engagement with customers.
Read More →
The Psychology Behind Menus That Increase Add-On Sales
There is a science to crafting a menu that gives customers confidence in the choices presented, and moving the process outside the F&I office can further boost results.
Read More →
Why Your F&I PVR Is Misleading You
Here’s a handy checklist of the numbers to track in 2026 instead.
Read More →
Auto Consumer Anxiety Presents Opportunity
A survey of U.S. drivers found the majority are concerned about finances and the economy, but those fears make many ready to buy vehicle-protection products.
Read More →
Humble and Hungry: 12 Rules for an F&I Life
Dustin Gingerich, with a decade in the F&I business under his belt, shares his thoughts on leadership, building trust with customers, and the importance of learning and innovation.
Read More →