Black Book’s Used Vehicle Retention Index shows 15 used-vehicle segments made gains in May, contributing to a 0.6% marketwide improvement over the past 12 months.
by Staff
June 5, 2018
2 min to read
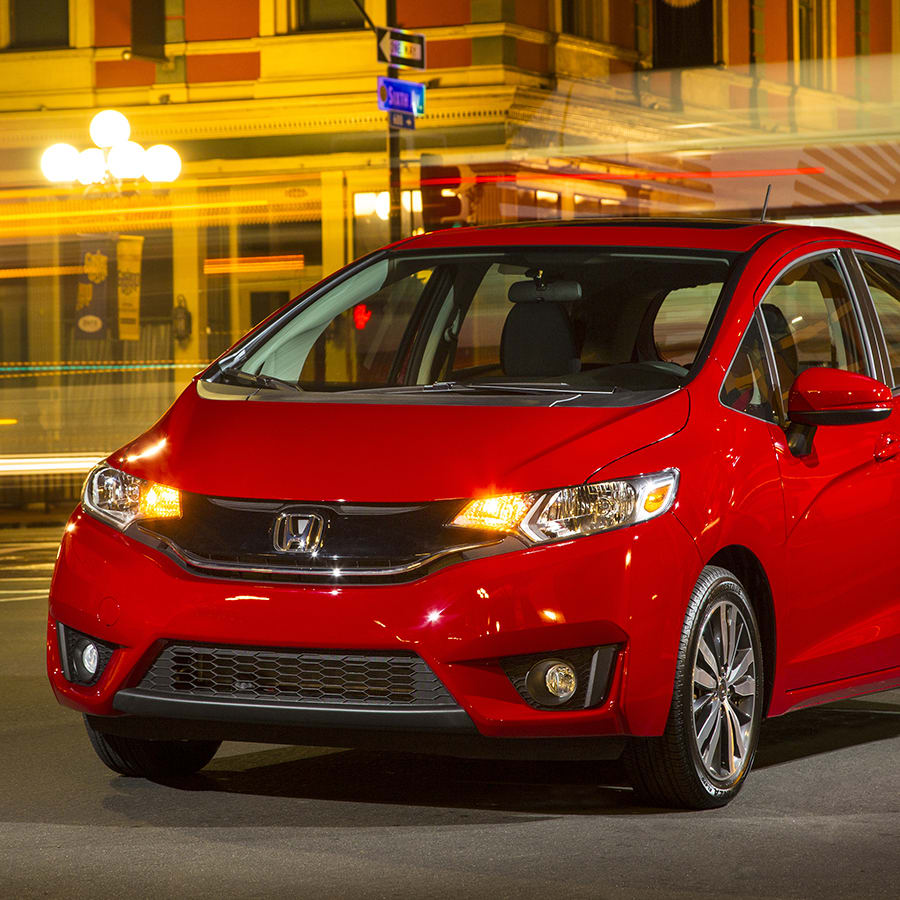
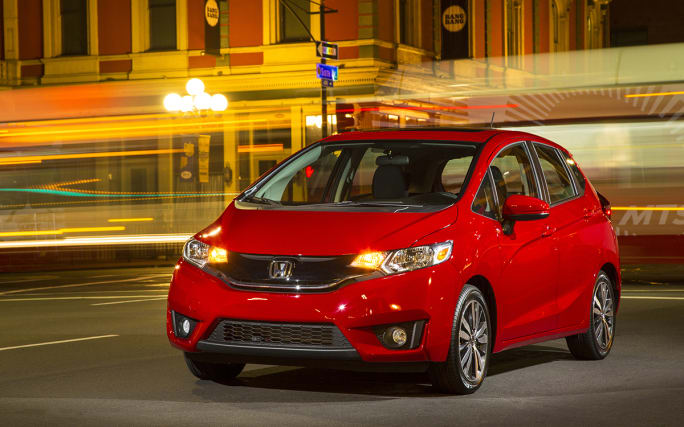
Values of subcompact cars such as the Honda Fit were up 1.7% in May, joining compact CUVs and SUVs as the best-performing used-car segments in Black Book’s latest report. Photo courtesy American Honda Motor Co.
LAWRENCEVILLE, Ga. — Black Book (div. Hearst) released its Used Vehicle Retention Index for May, showing that it increased 0.8% during the month — registering 112.9 — and up slightly from 112.0 in April. The index has now increased by 0.6% over the last 12 months (112.3).
The Black Book Used Vehicle Retention Index is calculated using Black Book’s published wholesale average value on two- to six-year-old used vehicles as a percentage of original, typically equipped MSRP. It is weighted based on registration volume and adjusted for seasonality, vehicle age, mileage, and condition to offer an accurate, representative, and unbiased view of the strength of today’s used-vehicle market values.
Ad Loading...
Reflecting the strong end to the spring selling season, the index saw 15 total segments with positive or unchanged results within the index, with subcompacts (1.7%), compact CUVs/SUVs (1.7%), full-size cars (1.2%), and “sporty” cars (1.0%) showing the strongest gains. The index has now shown a monthly decline in just three of the last 10 months dating back to August.
“The used-vehicle market is clearly benefitting from strong employment and consumer confidence currently, with many segments of both cars and trucks, large and small, seeing valuation strength over the last several months,” said Anil Goyal, Executive Vice President, Operations. “After spring season, we typically see a decline in values in May. However, this year the used market is fairly stable, resulting in an uptick in our seasonally-adjusted Index.”
The index dates back to January 2005, where Black Book published a benchmark index value of 100.0 for the market. During 2008, the index dropped by 14.1% while during 2016, the index fell by just 6.4%. During 2011, the index rose strongly from 113.3 to 123.0 by the end of the year as the economy picked up steam and used vehicle values rose higher. It continued to remain relatively stable, rising slightly until May of 2014 when it hit a peak of 128.1, according to the company.
Talk to F&I customers like you’d talk to a friend, without industry lingo or sales-like questions, and use hard proof to show, not tell, them about a need.
Helping F&I customers understand complementary offerings is likely to lead to more sales, based on the success of a high-performing practitioner of the philosophy.
In this video, Reese Dailey explains how effective follow-up drives better results
across the dealership, including increased sales, higher F&I penetration, and
stronger customer retention.
It may be human nature to back off when a customer seems to say no to a product or service. But experts say F&I managers should operate as though the answer will be the opposite.
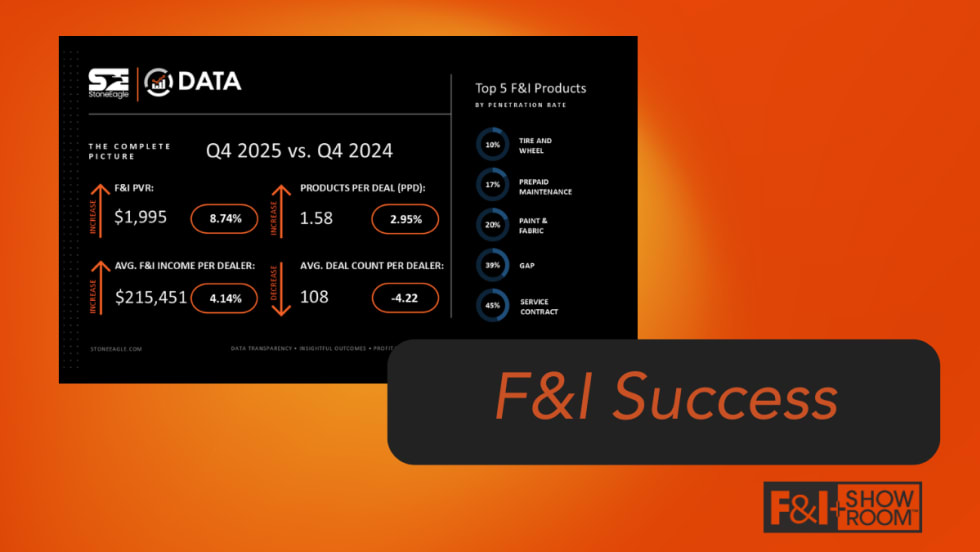
Deal volume ebbed and flowed throughout 2025, but product performance remained steady, according to automotive technology and data intelligence solutions provider StoneEagle.