
Black Book: COVID-19 Markets Updates
Black Book recently published an update to their COVID-19 Market Updates, which includes: current wholesale prices & price trends, used wholesale price trends & projections, a look at the retail vertical, new vehicle sales outlook, and used vehicle supply projections.

Black Book recently published an update to their COVID-19 Market Updates, which includes: current wholesale prices & price trends, used wholesale price trends & projections, a look at the retail vertical, new vehicle sales outlook, and used vehicle supply projections.
Image provided by Black Book
Black Book recently published an update to their COVID-19 Market Updates, which includes: current wholesale prices & price trends, used wholesale price trends & projections, a look at the retail vertical, new vehicle sales outlook, and used vehicle supply projections.
Summary
Wholesale Values
Thus far in July, we have seen wholesale prices increase by 4.2% as the market continues to be plagued by shortages of both used and new inventory. Last week saw a continuation of wholesale market strength. Volume-weighted, overall car and truck segments both showed gains for the eighth week in a row, increasing 1.45% overall this week (compared to 1.41% the prior week). As for specifics, the overall car segments increased by 1.80% (compared to 1.70% the prior week) and the overall trucks and SUV segments increased again this past week at 1.24% (compared to 1.24% the prior week).
The graph below shows week-over-week depreciation rates for the entire market, including Cars and Trucks / SUVs / Vans for the last several months. We have now experienced eight weeks of overall market rebounding with consistent week-over-week increases in almost all segments.
As we reported last week, for the month of June as a whole, we saw the largest ever recorded month-over-month increase in wholesale prices, as measured by Black Book’s Monthly Seasonally Adjusted Retention Index, increasing by a staggering 9.1 points. This increase corresponds to a 5.7% increase in wholesale prices. Full analysis of June’s Used Vehicle Retention Index is available on Black Book’s website.
Economic Conditions
In this week’s report we follow developments in the economy as COVID-19 pandemic continues to expand in magnitude outside of North Eastern states.
It is projected that consumer confidence will drop in July, although we saw the improvements in the Northeast as those states’ policies contained the spread of COVID-19
As many states slowed or reversed re-opening, it is expected that unemployment will increase over the next several months and will stay above 10% well into 2021
Gas prices continue to increase
Annual GDP growth is projected to stay negative in the third quarter as economic activity is slowly recovering from shutdowns in the second quarter
Without a substantial second federal stimulus, demand for used vehicles are expected to deteriorate even further.
Used Inventory
We expect a large, incremental influx of used inventory to hit the marketplace over the next six months, coming from prolonged lease return delays and downsizing of rental fleets. We did hear that Hertz sold a chunk of inventory to another rental competitor recently. In addition, lenders expect a significant increase in delinquencies and repossessions over the upcoming months as the economy continues to feel the effects of high unemployment. The number of accounts in ‘hardship’ jumped substantially in April and May across all risk groups, according to the Monthly Industry Snapshot by TransUnion. About 7% of all accounts were in hardship in May (double the April numbers and 18 times higher than a year ago). The number of ‘hardships’ increased across all risk tiers.
Due to these factors, we expect both wholesale and retail prices to deteriorate later in the summer. On the other hand, due to better than expected (but still very high) unemployment numbers, it is possible that the automotive industry will avoid a more catastrophic economic scenario (severe prolonged recession) that was considered as one of the scenarios in our residual value projections.
Longer Term View
Although the economic effects of the pandemic will continue to be felt as far out as three years from now (e.g. according to the recent CBO economic outlook report, the unemployment rate will not return to pre-COVID levels for at least a decade), we still project that wholesale vehicle values will return to the pre-COVID-19 baseline by 2023. Used supply will decline due to cuts in retail and fleet sales throughout 2020 and into 2021.
Economic Conditions
Since the beginning of April, weekly initial unemployment claims remained at record levels. Last week, the Labor Department reported that the US added 1.30 million new jobless claims (essentially unchanged from the week before). Since March, we have seen 16 consecutive weeks of record level layoffs and furloughs. The graph below compares weekly initial unemployment claims from the current recession against the Great Recession of 2007 – 2009. The severity and speed of job losses is unprecedented. The horizontal (x) axis is an offset (in months) from the beginning of the recession.
In the early stages of the crisis, the US unemployment rate in April skyrocketed to 14.7%, the highest monthly rate since the Great Depression. The May unemployment level decreased to 13.3% due to the success of the Federal Paycheck Protection Program (PPP) and other stimulus measures enacted in part by the Federal Reserve and Government. As the country and economy continued to reopen during the early part of June, the monthly unemployment numbers eased further to 11.1%. The Labor Bureau also noted in its reports that there was a classification error in its surveys, and the real unemployment numbers were actually higher for each month since March, as illustrated below.
Note that monthly unemployment numbers are based on a snapshot from mid-month, but the last several weeks of June suggest that conditions worsened due to the dramatic increase and spike in COVID-19 cases, and the corresponding reopening slowing as a result. There is also concern that without further federal stimulus, these gains will be temporary and employment numbers may deteriorate, as the PPP expired on June 30th. According to a recently released CBO report, “the unemployment rate is projected to peak at over 14 percent in the third quarter of this year” before declining in the fourth quarter.
This recession is very different and unprecedented in the labor market – reflecting an almost instantaneous jump in unemployment with projected fast growth within a year. The graph below compares unemployment rates for the last several major recessions. The horizontal (x) axis is an offset (in months) from the beginning of the recession.
Although we have seen a reduction in unemployment, the initial economic shock and job losses have created a deep hole for us to dig ourselves out of. Between February and the end of June, the nation lost close to 14.7 million jobs.
With a weakening of the economy and the increase of new COVID-19 cases across the South, now expanding to other hot spots across the country, consumer confidence dropped back to the lows of April. The University of Michigan’s Monthly Consumer Sentiment Index for July released last week suggests a decrease to 73.2 points. The report also predicts a further weakening in consumer confidence: “unfortunately, declines are more likely in the months ahead as the coronavirus spreads and causes continued economic harm, social disruptions, and permanent scarring.”
Not surprisingly, consumer confidence has been on a bit of a rollercoaster the last five months. At the beginning of the year it was strong – the University of Michigan’s Monthly Consumer Sentiment Index in February was 101 points. As the COVID-19 pandemic spread across US, the index dropped to 71.8 points in April and increased slightly to 72.3 points in May. During recent testimony by Federal Reserve Chair Jerome Powell, he noted that during the months of April and May, “stimulus checks and unemployment benefits are supporting household incomes and spending.” With these one-time stimulus payments and extended unemployment benefits helping the economy, the index for June increased further to 78.1. The gains, however, were not uniform across the country. With a significant reduction in the number of COVID-19 cases, the Northeast region led the way with a record 19.1 points month-over-month jump, while the Southern region rose just 0.5 points due to the dangerous increase in numbers of new infections and fear of further shutdowns.
As more economic data for the second quarter of 2020 arrives, “the GDPNow model [from the Federal Reserve] estimate for real GDP growth (seasonally adjusted annual rate) in the second quarter of 2020 was -34.7 percent on July 17th.”
Gasoline prices reversed the May trend and started to increase. Since the lowest point at the end of April, prices are up $0.43, to $2.20 per gallon last week, according to the U.S. Energy Information Administration.
Current Wholesale Market Overview
Auction Insights
Last week there was a notable increase in the number of 2017 and 2018 model year units with very low mileage available in the wholesale market. These were not your typical off-lease units, but instead, a sizable number of under 5,000-mile vehicles spread out across the country. With the lack of new inventory, it wasn’t surprising to see the demand for these low mileage units was strong and reflected in the sold prices.
Another notable increase this past week was the volume of vehicles that Ford ran. At multiple locations, we saw over 300 units spreading across as many as three lanes at a single auction location.
Manheim continues to rollout their in-lane bidding pilot program, adding 6 more locations this week. Unfortunately, due to a spike in COVID-19 cases, Manheim Fresno has been delayed in participation in the program. This now brings the total to 35 Manheim locations that are allowing in-lane bidding. ADESA started this a few weeks ago and has continued this option without delays.
Auction Volume
Despite most auctions continuing to operate under an all-digital platform, sales volume has rebounded to a level consistent with, and on some days higher than, this time last year. This is being driven by strong retail sales and the need to backfill, which are then leading dealers to use auctions as their main source of inventory. The number of sales bottomed out around an 80% year-over-year decline when most auctions closed their physical sales (and some closed entirely) at the end of March. The graph below illustrates the estimated year-over-year change in sales volume of the wholesale market. The red line is the base line, and any dots above the line indicate higher amounts of sales than the prior year. You can easily see just how far we have come since April’s lows.
Sales Rate
At the onset of the pandemic, as shelter-in-place orders went into effect, sales rates quickly tumbled into the teens, but rates have been climbing each week and have now stabilized. Independents that have been operating a traditional physical sale continue to report the highest sale rates. Black Book’s estimate of the Weekly Average Sales rate is presented below.
Current Wholesale Price Trends
Current Market Level View
Volume-weighted, overall car segment values increased 1.80% this past week. Typically, this time of year we normally see values decreasing. For example, during the same week last year, overall car segments decreased –0.54%. In stark contrast this past week, all car segments increased at a rate of greater than 1%, except for the Premium Car segment that fell shy at 0.96%. The Sporty Car segment led the increases at 2.68%, the largest car segment increase on record. When volume-weighting is applied, the overall Truck segment (including pickups, SUVs, and vans) values increased by 1.24% last week with all segments increasing. The Small Pickup and Sub-Compact Luxury segments led the increases for the Truck/SUV segments with increases greater than 2%. Sub-Compact Crossovers, Compact Vans, and Full-Size Trucks were not far behind with increases of 1.75% or greater.
Year-Over-Year View on Wholesale Prices
The graph above compares Black Book’s Seasonally Adjusted Retention Index for 2019 and 2020 calendar years. The Black Book Used Vehicle Retention Index is calculated using Black Book’s published Wholesale Average value on two- to six-year-old used vehicles, as a percent of original typically-equipped MSRP. It is weighted based on registration volume and adjusted for seasonality, vehicle age, mileage, and condition. The Index offers an accurate, representative, and unbiased view of the strength of used vehicle market values. It measures an ‘apples-to-apples’ year-over-year retention comparison.
2020 started slightly below 2019 levels, but the market showed early strength in February and March. As the US economy shut down due to the COVID-19 pandemic, we measured the highest single month drop in April of 6.9 points since launching the Index. As we entered July, wholesale prices continued the rebound that began during the second half of May and continued through the month of June, with June’s Retention Index climbing back to pre-COVID-19 levels with a record jump of 9.1 points. We project that July’s Index value will stay flat and on par with last year’s index.
During the last recession (2007-2009), the Index lost about 15 points in a span of 12 months before the recovery started. We project that during the current recession, the Index will decline over the next six months, but will start recovering afterwards, based on our most likely economic scenario. One of the main differences between the current and previous recession is the forced and abrupt shutdown of assembly lines and, as a result, significant reduction in projected used vehicle supply in 2021 and beyond.
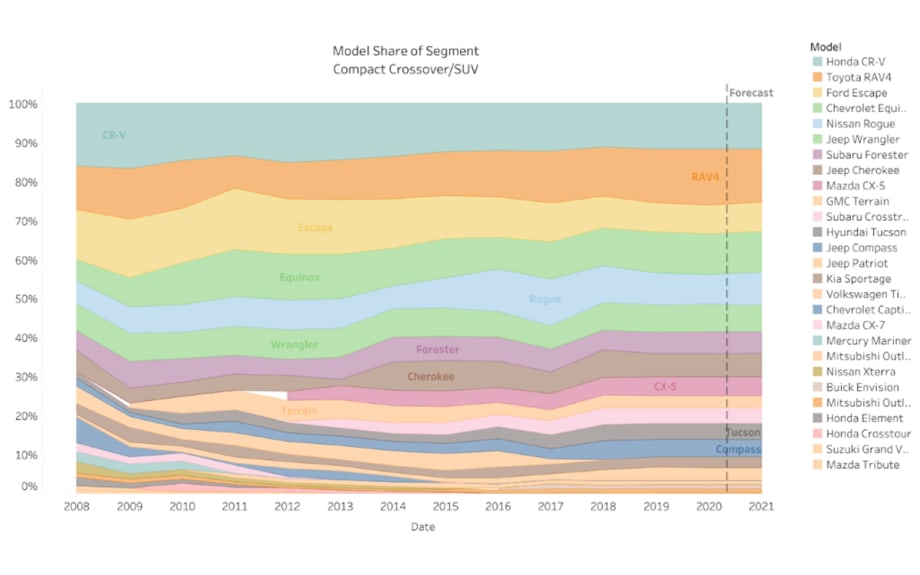
Segment Highlight – Compact Crossover / SUV
Segment Overview
The Compact Crossovers/SUVs (CSU) segment has grown in popularity in recent years as consumer preferences have shifted from cars to crossovers. CSU has grown significantly, from 9% of market share in 2007 to 20% to date. Currently, it is the largest vehicle segment and provides consumers the functionality they desire with the easy and fun to drive feel of a sedan. This segment is beneficial to the industry because most (non-luxury) manufacturers have entered this segment, there are low barriers to entry for consumers, and the competitiveness of the segment forces manufacturers to stay current with demand. In fact, some OEMs have decided that the best way to cover this market share is to have multiple entries within the segment: Jeep has Cherokee & Compass, Mitsubishi the Outlander and Outlander Sport, Subaru Crosstrek and Forester, etc.
Historical Trends
Prior to 2008, the popularity of Crossovers/SUVs was growing, and the Black Book Retention Index for Compact Crossovers was trending along with the market level Index, reaching a high of 108.2. During the recession in 2008/2009, the Index fell to a low of 76.1 for the segment, as compared to the market level low of 89.1. As the segment share and popularity have grown, the market has become more competitive, and this has kept the retention lower than the overall market. During the COVID-19 shutdowns, the Compact Crossover segment also experienced a large change, falling 8.7% from March to April, down to 90.8. While this decrease is significant, it is not as large as the 11% drop experienced by the Compact Car segment. In June, the segment recovered most of its value with the Index jumping back to 98.0 points.
Recent Depreciation Rates
The Crossover/SUV segments are highly competitive and have seen quite a bit of volatility in prices throughout the pandemic. Prior to the pandemic, prices for all segments were on a normal seasonality pattern with incremental increases leading into what was expected to be a strong Spring. However, at the onset of the pandemic when fuel prices began to fall and shutdowns forced people to shelter-in-place, the similarities in market movements between the Crossover/SUV segments ended. The fuel-efficient Compact and Sub-Compact Crossover segments experienced much stronger depreciations than the overall Truck/SUV market and the larger Mid-Size Crossover/SUV segment. However, the rebound has been stronger with Compact Crossovers, experiencing large week-over-week increases in recent weeks.
Model Spotlight – Redesigned 2021 Nissan Rogue
The Nissan Rogue is a big player in the Compact Crossover segment. It has 8% of the segment share and is the volume leader for Nissan after taking the top spot away from the Altima in 2016. The Rogue is receiving a major redesign for the 2021 model year, which was unveiled to the public last month and is expected to hit dealer lots later this fall. It is powered by the previous generation 2.5-liter four-cylinder engine but gains a bump in horsepower – 181hp compared to model year 2020 at 170hp. As with most of the Nissan line-up, a plethora of safety features are standard on every vehicle. Safety Sheild® 360 includes automatic emergency braking with pedestrian detection, blind-spot warning, rear cross-traffic alert, rear automatic braking, lane departure warning, and high beam assist.
(Source: Car and Driver)
Not only does this new generation come packed with standard safety features, but it also has a suite of optional features such as ProPILOT Assist with Navi-link that uses GPS navigation to improve the intelligent cruise ride quality by anticipating curves and interchanges and adjusting the speed appropriately.
As for styling, Car and Driver recently reviewed the vehicle and gave approval of the “chunkier look” to the exterior and the “uptick in material quality” on the interior.
Pricing has yet to be announced but assuming it stays in the ballpark of the outgoing generation, the entry level trim should be around $26,000.
Used Wholesale Price Projections
Wholesale Price Impact Under the Most-Likely Economic Scenario
Wholesale prices dropped significantly in April as uncertainty over COVID-19 impact and response dampened vehicle demand, resulting in an overall wholesale price decline of 5.9%. We saw a substantial improvement in prices during the last two weeks of May, and the monthly decrease was limited to only -1.5%. In June, wholesale prices continued to increase, and the overall market appreciated by a record 5.7%. As a comparison, last year’s prices declined by 0.9% over the same period. As we pass the midpoint in July, prices continue to improve and we predict we will end the month at the same level as was projected prior to COVID-19.
Black Book’s July Published Residual Values (dashed lines) reflect a new economic reality. Once the temporary strengthening in June passes, we project the values to stay below pre-COVID-19 forecast over the next two years, with the deepest declines expected over the next six months. The green line represents our most-likely economic scenario, which does not include a possible second wave of COVID-19, as well as a still undefined second stimulus package. A more severe and prolonged recessionary scenario is shown in red. Projections are indexed to the pre-COVID-19 projections (black line). All values are weighted by the used vehicle sales volume (actual, where available, or projected).
Short-Term Outlook (Fall of 2020)
We project a drop in wholesale prices compared to a pre-COVID-19 baseline this fall, as the US economy suffers through the effects of COVID-19. We anticipate that later this fall, wholesale prices will be approximately 10% lower than originally projected before the pandemic, due to a glut in supply and much weaker demand. Prices will start to recover in 2021 as the economy becomes stronger. We also anticipate that older (>6-year-old), cheaper vehicles in average condition will not decline as much due to increased demand for these units. Additionally, we project that newer (zero- to one-year old models) will retain their strength in the near future due to continuous shortage of new inventory.
Long-Term Projections (36-Month Residual Values, Fall of 2023)
The effects of the pandemic will continue to be felt 36 months from now. We continue to project that values will return to the pre-COVID-19 baseline as used supply will decline due to cuts in retail and fleet sales throughout the remainder of 2020 and into 2021.
Wholesale Price Impact Under a Severe Recession Scenario
In this scenario, we project a decrease in wholesale prices of between 15% and 20% later in the Fall, compared to a pre-COVID-19 baseline, with a slow recovery in 2021. The effects of the pandemic and recession will still be impactful in 36 months, and we project a 10% market level decline of wholesale prices as compared to pre-COVID-19 projections for the second half of 2023.
Retail Vertical
Used Retail Prices
In the age of proliferation and ‘no-haggle pricing’ for used-vehicle retailing, asking prices accurately measure trends in the retail space. From the peak in early April until the end of June, retail listing prices decreased by about 4%. Since the second week of June, we saw a stabilization of used retail prices fueled by higher consumer demand due to stimulus payments and the federal Paycheck Protection Program (PPP) and limited used and new inventory. In the last 6 weeks, used retail prices rebounded by about 2.3%. We expect used retail prices to decline later in the summer as stimulus payments are exhausted and the protection in PPP expire.
Used Retail Inventory
Many dealers continue to report a shortage of used inventory in the wholesale marketplace. As a result, from the peak in February, we’ve seen a decline in the number of used retail listings by about 25%. The true shortage of the vehicles is probably not as severe as this decline would lead you to believe, as many dealers sell some of their best inventory in the first several days before listing them online. Nevertheless, the shortage of used inventory helps keep retail prices elevated even in the weak economic conditions.
The graph below shows the weekly average of the number of retail listings collected by Black Book, indexed to the first week of the year. We see a continuous decline in the numbers starting at the beginning of May as economy started to open up in the states outside of the Northeast.
Dealers Insights
The inventory shortage continues with only small improvements for new vehicle dealers as they are gradually receiving small deliveries.
The good news for dealers is that even while new vehicle deliveries are scarce, the vehicles don’t last long on the lots, especially when it is a Full-Size Truck that is being delivered. The volume of deliveries is still very limited as production continues to struggle to catch up due to the shutdowns.
As for new car production, OEMs continue to struggle to return to normal levels of output.
General Motors suspended the third shift at their Wentzville, MO plant due to employee absenteeism caused by COVID-19 case spikes in the area.
Ford is having difficulties receiving parts from a plant in Chihuahua, Mexico that is the result of staffing restrictions mandated by the Mexican government that limits the number of employees allowed to 50%.
Retail vs. Wholesale Prices Trends
Each week, members of the Black Book automotive analyst team, data science team and executive leadership team speak with no less than 30 dealers, along with buyer and seller representatives, wholesalers and others, who represent hundreds of franchise and independent dealers nationwide. These industry experts, along with experts we speak with from leading fleet management and rental car companies, auction leadership, and other industry experts, help to clarify and connect the dots between the wholesale and retail markets, adding to the insights our data reveals.
Since the start of the pandemic, we have been observing different trends in wholesale and retail prices (see graph below). In April and May, wholesale prices declined at a higher rate compared to retail prices. As margins grew, dealers reported healthy profits on a per vehicle basis. Retail prices displayed stickiness on the way down. Similarly, as wholesale prices came roaring back to pre-COVID-19 levels, retail prices are slow to recover, exhibiting the same stickiness on the way up. As wholesale to retail margins shrink, it is even more important for dealers to stay up to date on market movements. We are seeing this trend play out on dealership lots, where retail asking prices are not increasing at the same level as wholesale transaction prices. This means dealers are paying more at auctions and through wholesale channels, but those increased wholesale acquisition prices, as a percentage, are not flowing through to the retail lots and online listings, and ultimately to the consumer. The main driver of the slow increase in retail prices, based on our conversations with dealers, is simply the fear of sitting on inventory for too long and the market making a quick reversal, which leaves them stuck with a vehicle they paid too much for. Dealer sentiment is quite clear—if they are going to pay up for a vehicle in this environment, they are choosing to turn them quickly, even with less margin than normal, to ensure they are not caught with high priced inventory when the market does shift. There is no long game here. There is simply a need to fulfill demand in a risk filled environment.
The graph below shows this retail / wholesale dynamic since the start of the year. Prices are indexed to the first week. The black line is Black Book’s Retention Index (not adjusted for seasonality). It is calculated using Black Book’s published Wholesale Average value on two- to six-year-old used vehicles, as a percent of original typically-equipped MSRP. It is weighted based on registration volume and adjusted for vehicle age, mileage, and condition. The blue line is a retail index – average listing price of available retail inventory adjusted for mileage.
CPO Retail Sales
Certified Pre-Owned has grown in popularity as it provides consumers with an affordable used purchase option with low mileage (a typical 3 year-old CPO vehicle will have around 5,000 less miles than a similar non-CPO vehicle), but with the peace of mind that comes with a new purchase with the additional warranty. Some OEMs also offer special financing rates and terms for their CPO vehicles. For dealers, the cost to certify a vehicle is typically minimal and the return on the retail is typically greater. CPO vehicles are typically viewed as nicer condition units as there are minimum criteria a vehicle must meet to be able to be certified and these typically involve age and mileage restrictions.
There are additional benefits to consumers that purchase through some OEMs, such as GM that offers an exchange program on their Chevrolet and GMC CPO units. If the customer changes their mind within three days or 150 miles, the purchaser can exchange it for any Buick, Chevrolet, or GMC CPO vehicles.
For some dealers, there is additional incentive to CPO a certain percentage of their used inventory as it bumps up their status with the manufacturer. For example, BMW takes into consideration a dealer’s CPO sales volume when deciding on the dealership’s new car allocation.
Cost of certifying a vehicle ranges by manufacturer. Typically, for mainstream OEMs, the cost to the dealer is $500 or less per vehicle, but luxury vehicles can reach into the thousands of dollars and vary by model. In most cases, the full cost to CPO a vehicle is the responsibility of the dealer, including any reconditioning that is necessary for it to get certification.
Retail prices of CPO vehicles are generally about 3.5% higher than a similar non-CPO vehicle (adjusted for mileage). But the just like the cost to CPO a vehicle, the difference varies among the segments and, for example, can climb to about 7% for near luxury sedans.
New Vehicles Sales Outlook
Our New Sales Outlook remains unchanged from last week. We anticipate a significant reduction in US new vehicle sales in 2020 (both retail and fleet sales) due to continued reduction in consumer demand. This is a result of several ongoing factors, including less miles driven due to remote work and shelter-in-place initiatives, high unemployment, and an overall feeling of uncertainty by consumers. Overall, new sales were down 23% during the first six months of the year compared to last year (with a 27% YOY decline in June as most states started to lift shelter-in-place orders). Even as OEMs are restarting assembly lines, there are significant challenges ahead in order to return to a normalized production schedule as we reported in previous updates. US manufacturers are planning to get back to pre-COVID-19 levels in July as new production protocols and supply chain disruption slowed down the re-opening. The graph below shows our current projections for new vehicles sales for the rest of 2020.
Due to continuous production disruption and much weaker demand due to economic slow-down, we project a 25% drop (compared to pre-COVID-19 projections) in new sales in 2020 to 12.7mm units in our base economic scenario. In a deep economic recession scenario, we project a 40% drop in new sales in 2020 to 10.2mm units as economy dips into a prolonged recession.
In the longer-term, we expect new sales volume to return to pre-COVID-19 levels within five years.
Used Vehicle Supply Projections
Black Book projects a higher than expected used vehicle supply in the wholesale marketplace for the rest of 2020 due to several factors:
Delayed lease returns resulting from lease extensions offered by OEMs – more than 560,000 additional three-year-old units
Extensive de-fleeting by rental car companies, due to lack of consumer and business traveler demand and financial pressure to raise cash – at least 250,000 one- to two-year-old vehicles
Dramatic reduction in auction activities due to COVID-19 in March, April, and May
Increased repossessions due to deteriorating economic conditions in addition to delayed repossessions in April / May
Short Term Lease Return Projections
When we started the year, lease returns were projected to hit a record volume of above 4.1 million units. Once the pandemic was underway and most manufacturing stopped, OEMs started to encourage lease extensions in order to push returns further into 2020 when they would be able to provide replacement vehicles. As a result, we project at least 560,000 additional units in the second part of 2020 (compared to the pre-COVID-19 estimates) due to a slowdown in sales in April / May, along with expected turn-ins of the lease extensions.
Rental Unit Returns
Business and leisure travel collapsed at the end of March. We expect a significant reduction in both categories for the remainder of 2020. In addition, there is no expectation that travel will return to pre-COVID-19 levels over the next several years. According to IATA (The International Air Transport Association), air travel will not return to pre-COVID-19 levels until after 2023. This puts tremendous financial pressure on rental companies that rely on air travel to reduce both their current fleet and scrutinize future vehicle acquisitions. At the end of May, Hertz filed for bankruptcy in North America as a result of the pandemic.
In addition to Hertz, we expect other rental companies will continue to reduce their fleet during the fall months to match lower demand for rentals. This practice will lead to over 250,000 additional rental units hitting the wholesale market over the next six months. Note that this is a base case scenario in which rental companies (excluding Hertz) can gradually reduce their fleet instead of a rapid-fire sale.
The graph below shows Black Book’s projections for rental returns. The purple line shows the difference between current (darker rectangles) and pre-COVID-19 projections (lighter rectangles).
In the longer term (later 2021 – 2023), the drop in rental return volume will benefit the price of newer used units, as supply will be limited.
Longer Term Used Returns Projections
With the reduction in retail and fleet sales over the next several years, we project approximately 75k used units per month less in the market in 2023, compared to previously projected returns. This lower level of used inventory will be beneficial to used car prices as supply will be limited, helping to bolster valuations.
Read: Fuel Capital Group Selects PassTime® as Exclusive GPS Provider
More Showroom

California Hybrids Reach State Record
The Golden State still leads the country in electric-vehicle registrations, but much like the rest of the U.S. its hybrid market share is up while full electrics stabilize after a dramatic first-quarter dip.
Read More →
My Mercedes in the U.S.
The German brand debuted its studio dealership concept for the first time in the states in Los Angeles, tapping Americans’ penchant for creative distinctions.
Read More →
Used Sales Hit Summer Drag
The vacation season, combined with high prices, has dented deliveries and added to inventories, though supply is still slim enough to keep listings elevated.
Read More →
California Launches EV Rebate Program
Participating automakers are matching the state's $13.5 million investment in new electric-vehicle rebates scheduled to take effect later this summer.
Read More →
OEM Poll Sees Industry Evolution
Kerrigan Advisors’ survey of automakers finds that tariffs, technology, network tightening and other factors are poised to reshape auto retail.
Read More →
The Trade-In Paradox
Retailing older cars with confidence in today’s market is a matter of establishing and following a clear process that can turn greater profit for auto dealers as they aim to meet used-unit hunger.
Read More →
Focus on Vehicle Cabins
The market for interior materials will grow in coming years as automakers look to meet consumer demand while staying competitive with changeups to sourcing and included features.
Read More →
State Follows Federal Warning on Auto Ads
The Massachusetts attorney general cautioned the state’s automotive dealers to be upfront with the consuming public about their vehicle prices or risk punishment.
Read More →
European EV Market Hits Record
Seven out of the top 10 electric vehicles sold so far in 2026 in Europe are by European brands, and automakers are seeing the power train fill up their order books.
Read More →
Used EVs Outpace New
While North American electric-vehicle sales remain down year-over-year, May sales saw a 3% increase from April’s numbers as used EVs led the market.
Read More →